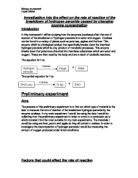
At low temperatures, for example below 30°C when increasing the temperature more heat energy is produced. Increasing the temperature also increase the kinetic energy causing the enzyme and substrate molecules to move faster and to collide more frequently.
As the temperatures increase further the enzymes and substrates move even faster. But, because of the speed of the collisions some of the bonds of the enzyme break. As the bonds break the enzyme loses its shape and the active site is affected, causing the substrate to no longer fit into it. This is when the enzyme is denatured and once an enzyme is denatured it can no longer react with another active site because it does not regain its correct shape, even if the temperature is lowered.
If the temperature is decreased to below or near freezing then the enzyme is not denatured but is inactive, so they do not react. Inactive enzymes will start to react when the temperature are raised.
Effect of pH on enzymes
pH is the measure of concentration of hydrogen ions in a solution. The higher the concentration of hydrogen ions, the lower the pH value. Different enzymes function over a different pH range, but most enzymes function best over a narrow pH margin. If the pH is changed to be below or above this margin then the results change a lot.
The pH has two main effects on enzymes:
- When changed it can break the ionic bonds. When this happens then the active site is changed so that the substrate can no longer fit into the active site. When this happens the enzyme is said to be denatured.
- When changed the charges on the amino acids are changed, so because they are in the active site the enzyme will not be able to form a enzyme-substrate compound.
Effect of Enzyme Concentration
As long as the concentration of the substrate is kept at a high level and other variables such as pH and temperature are kept constant, than the graph should be a straight line through the origin. Therefore the rate of reaction is directly proportional to the concentration of the enzymes.
Effect of Substrate concentration
When the concentration of substrate increases then the rate of reaction also increases. As there are lots of substrate molecules present, an active site can bond with more than one substrate at any one time.
Variables
Oxygen production could be varied by: -
- Surface area of a potato
- Concentration of hydrogen peroxide
- Temperature
- pH
- Volume of hydrogen peroxide
The independent variable I have chosen to change from the given list is surface area of a potato. The dependent variable which I am going to measure is oxygen production, every 30 seconds for five minutes.
To make this experiment a fair test the volume of hydrogen peroxide will be constant at 12cm³ and the hydrogen peroxide will be at a concentration of 20%. The temperature will be kept at room temperature to stop the heat affecting the oxygen production. The control for this experiment will be the hydrogen peroxide by itself.
A Plan for the Investigation of the Breakdown of Hydrogen Peroxide
Apparatus: Cork borer
White tile
Trough
Boiling Tubes
Stop Watch
Potato
Delivery Tube
Kitchen Knife
20% volume of Hydrogen Peroxide
10cm³ Measuring Cylinders
25cm³ Measuring Cylinders
Ruler
The cork borer has been chosen to cut pieces of potato the same size in diameter and length. The 10cm³ measuring cylinder will be used to collect the oxygen in the trough and the 25cm³ measuring cylinder will be used to measure the amount of hydrogen peroxide needed for the experiment.
Diagram to show the Set up of the Apparatus
Method:
- Cut the top and the bottom off the potato and make sure the base and top is flat.
- Take the cork borer and cut out three cylinders of potato.
- Half fill the trough with water and fill the 10cm³ measuring cylinder with water to the top.
- Place the measuring cylinder in the trough, by tipping it upside down under the water in the trough making sure there are no air bubbles at the top of it. Place the end of the delivery tube inside the measuring cylinder.
- Measure out the 12cm³ in the large measuring cylinder and then put it in the boiling tube.
- Take the cylinder piece of potato and place it in the boiling tube, replacing the bung of the delivery tube as soon as the potato has touched the hydrogen peroxide and starting the stopwatch.
- Record the oxygen production every 30 seconds for five minutes.
- Repeat at least twice to make it a fair test.
To be able to work in a safe environment make sure goggles and laboratory coats are worn. The hydrogen peroxide is a form of bleach and is to be kept away from the face. If any gets onto your hands, wash them straight away. If any get into your eyes tell your teacher immediately and flush your eye with plenty of water.
Results of Preliminary Experiment:
Graph 1
Length of potato= 5cm
Surface Area = 8.25cm²
Hydrogen Peroxide =12cm³
Oxygen Production
Graph 2
Length of potato = 4.5cm
Surface Area = 2.78cm²
Hydrogen Peroxide = 12cm³
Oxygen Production
Unfortunately due to a mistake I made, instead of changing just the surface area, I changed the mass as well. This caused some of the results to be inaccurate, as two variables were changed instead of one.
When the final experiment is done, the mass of the potato will be kept the same, but the surface area will be changed only. Hopefully this should make the results more accurate.
Results of Final Investigation:
Graph 3
Pieces of potato= 1x 5cm
Surface Area = 8.25cm²
Hydrogen Peroxide = 12cm³
_ Oxygen Production
Graph 4
Pieces of potato= 2x 2.5 cm
Surface Area = 8.6 cm²
Hydrogen Peroxide = 12cm³
Oxygen Production
Graph 5
Pieces of potato = 4 x 1.25 cm
Surface Area = 9.4cm²
Hydrogen Peroxide = 12cm³
Oxygen Production
Graph 6
Pieces of potato= 5 x 1cm
Surface Area = 9.8 cm²
Hydrogen Peroxide = 12 cm³
Oxygen Production
Analysis
When doing this experiment, the amount of oxygen produced was recorded and used to draw a graph to see if the hypothesis predicted at the start of the investigation has been proved or rejected.
Graph 1
This graph was drawn using the results from my preliminary experiment. The experiment was repeated twice to see if the results collected the second time were about the same as the first. From the graph I can say that there is a steady rise in oxygen production in the second set of results from the first minute of readings to the end of the experiment. There is one point plotted on the graph that is not plotted like the others in a steady line. This is the point in the time of four and a half minutes, which is slightly lower than the steady line of oxygen production up until five minutes.
The first attempt did not produce as good results. The line drawn after the results were plotted shows a line that goes up and down from the one minute mark. Again, a couple of the results recorded are lower than a straight line from one minute to five minutes. These points are at the time of four and a half, two and a half and one and a half minutes. These errors might have been made by me reading the amount of oxygen production wrongly on the measuring cylinder.
Graph 2
This graph was also drawn using the results that are totally inaccurate, because two variables have been changed instead of just one. This data recorded, when plotted was just a straight line through the origin, except for three points which are out of line. These points are at three and a half to four and a half minutes. These points are slightly higher than the straight line. This mistake was made because of an error made while reading the oxygen produced while it was in the measuring cylinder.
Graph 3
This graph was drawn by using the data produced when doing my real investigation. One piece of potato was used at a length of 5cm with 12cm³ of hydrogen peroxide.
On the first attempt of getting results, when plotted on the graph, the oxygen produced was plotted in a near straight line. The amount of oxygen produced rose steadily for the first minute. After the first minute there was a large increase in oxygen production with a minute and a half being 1 cm³ higher than the 30 seconds before. After the 1 cm³ increase in 30 seconds the oxygen produced did not rise as sharply as before, but at a steady speed.
On the second attempt for the first minute the same amount of oxygen was produced as in the first attempt. However, unlike the first attempt there is a very small increase of oxygen that was produced. However, after this dent in the line there is a straight line, apart from two points at four minutes and at four and a half minutes. When the mean was calculated and plotted onto the graph it is a straight line with only one or two anomalous results.
Graph 4
This graph was done with the results collected from the two pieces of potato at 2.5 cm in length, with 12 cm³ of hydrogen peroxide. This graph begins with a steady production of oxygen for the first minute in both attempts. The first and second attempt of trying to produce oxygen, the results rose constantly with only a couple of ‘slow’ moments where not much oxygen was produced, for example at three and a half minutes.
In the second attempt however, the oxygen produced was only constant at the beginning and end of the experiment. The second attempt did not produce the result I would have liked it to produce. This attempt’s results are not very accurate or precise.
Graph 5
As the graph shows the results plotted are very close and except for a couple of anomalous results, the other results are in a straight line from the origin to the last result. A couple of results that are wrong are one and a half minutes and two minutes, which are higher than the straight line. The time 3 ½ minutes however is lower than the straight line.
The second attempt however, had just about every result plotted above the line. Theses results go up and down like a ‘yo-yo’. There is only one point on the line where the oxygen rises steadily for one minute. This is happening from 2 ½ minutes to 3 ½ minutes. These inaccurate results are still showing me that the larger the surface area the more oxygen produced, therefore proving my prediction.
Graph 6
Again, this graph is totally inaccurate, with no constant amount of oxygen being produces at any time except for the first minute of the second attempt. This does not matter however because as the graph has been drawn it shows that there is a high amount of oxygen being produced with a large surface area.
The first set of results are not very precise. The amount of oxygen jumps all over the place, with there not really being a line. The second set of results is also not very precise, with results all over the graph. At 4 minutes and at 4 ½ minutes the results are exactly the same. Most of this graph is made up of anomalous results.
Evaluation
My graphs are plotted and drawn from results collected in my preliminary and final investigation experiments. In the preliminary investigation two graphs were drawn. They are graph one and graph two. The preliminary investigation was done as in the plan with 12 cm³ of hydrogen peroxide placed in a boiling tube and water was placed in a trough and a in a 10cm³ measuring cylinder. The delivery tube was then placed in the measuring cylinder after it had been turned upside down into the water of trough without getting any air bubbles that might affect our results. The potato piece was placed in the boiling tube, the bung was placed on the top of the boiling tube and the stopwatch was started. Every 30 seconds according to the stop watch the amount of oxygen produced was recorded in the tables. These results were then added together to find the mean, which was also plotted on the graph.
Of the four graphs drawn for the final results, a final graph was drawn using the mean which was taken for each attempt. This was done by adding up the 10 results recorded at the correct times and dividing by 10. This was done for both attempts and for every size or length of potato, for both attempts. Then the two means were added together and divided by two to give a total mean. This was repeated for a further three times to draw graph 7. These means were then joined together to see if the larger the surface area, the more oxygen produced.
What can be seen from the graph is that there is an anomalous result. This was the first part of the investigation being done. The surface area for the anomalous result is 8.25cm², or one piece of potato at 5cm in length.
Apart from this one anomalous result, the hypothesis made at the beginning of the investigation,
“I predict that the greater the surface area the more oxygen will be produced in the first five minutes of collecting oxygen.”
has been proved on graph 7. This shows us that as the surface area increases so does the amount of oxygen produced. This is because when there is a large surface area, then there is more room for collisions to happen and they therefore happen very quickly and continually. On graph 8 it also shows that the prediction has been proved but on a smaller scale with the pieces of potato on the x-axis and not the surface area.
If I had to redo the investigation experiment, then I would change my method so that the delivery tube was placed inside the measuring cylinder after the potato was cut and the hydrogen peroxide measured out and placed inside the boiling tube. The delivery tube would be the last thing I would place in position before the potato and bung were put in the right place.
When I do redo the investigation, I will then record my results accurately and make sure that they are taken at the right time reading the numbers correctly, from the scale on the measuring cylinder.
Bibliography
The book that all my scientific information came from is a Human Biology AS level text book. (The photocopy of the front cover is in the back of the coursework)
Title: New Introduction to Human Biology
Authors: Bill Indge
Martin Rowland
Margaret Baker
Evaluation
When doing this experiment, the 10cm³ measuring cylinder was filled with water to collect the oxygen. Unfortunately when the measuring cylinder was turned over there might have been an air bubble at the top of the measuring cylinder and therefore the amount of oxygen collected in the measuring cylinder would be inaccurate. The air bubble was caused by there either, not being enough water in the measuring cylinder or it was turned upside down above the water therefore the water escaped. Also when the potato was cut and placed straight away into the hydrogen peroxide the potato was fresh and moist. However, when the potato had been cut a time before it was placed into the hydrogen peroxide, the potato was not as fresh and was dry with the catalyse inactive.
A couple of anomalous results are the ones that are not close to the line of best fit. These results would need to be done again to see if this is just because of an error made or whether the line of best fit is in the wrong place. These anomalous results are at surface area 8.3cm² (1 piece of potato) and at 9.8cm² (5 pieces of potato). However, when the potato pieces were placed into the hydrogen peroxide, the pieces of potato stuck together. When these pieces of potato stuck together the surface area is changed and therefore the results are voided and inaccurate. To stop these pieces of potato sticking together they can be dropped in one at a time and not all together.
If I still had the same potato I would do some of the experiments again. Graphs 7 and 8 have error bars, which is the median of the first attempt and the median of the second attempt and then the overall median. The smaller the error bar the more precise the results are. These graphs have median size error bars and therefore the results can be in a range of the two medians. As these error bars are of a medium size more results need to be taken to see if that result falls in between the error bars.
Overall, to improve these results I would do the investigation in a longer time to make sure that the measurements are very accurate and precise and also that the oxygen in the measuring cylinder is measured at the correct time and accurately.