Current has the symbol (I).
Charge has the symbol (Q).
Resistance has the symbol (R).
The conventional current is the flow of negative electrons, therefore actual electrons flow in the opposite direction.
Ohm’s Law
If the temperature of the conductor does not alter, the current that flows is proportional to the potential difference applied.
If the temperature does change and the metal is heated up, the metal ions will vibrate more. This means that there is a greater chance of a n electron bumping into a metal ion and increasing the resistance, and in turn decreasing the flow of electrons.
Prediction
When a metal wire is placed into an electric circuit, the voltage supplied from the battery or power supply makes the electrons in the wire flow through it. As they do, they collide with the metal ions and the flow of electrons is slowed down. The metal ions resist the flow of electrons. Resistance is a measure of how easily the electrons can flow through a wire. The bigger their resistance, the harder it is for the electrons to flow through the wire. This means that less electrons will flow through the wire per second, therefore the smaller the current that is produced by a particular voltage, or the bigger the voltage needed to produce a particular current. Resistance is measured in Ohm’s (volt per amp).
I think that the thicker the wire is the lower the resistance will be. I think this because the thicker the wire the larger the surface area of the wire, which means there will be more electrons on the surface of the wire and therefore more electrons to flow through the wire and produce an electric current. The more electrons there are on the surface of the wire, the bigger the current produced will be and the bigger the force of the current. The resistance is lower when the force of the electrons is bigger as the electrons will be travelling through the wire with such a force that the resistance will be reduced.
Equipment
Ammeter
Voltmeter
Adjustable power supply
5 different thickness’ of constantan
Crocodile clips
wires
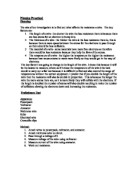
Preliminary Work
Preliminary work was done to help find a suitable method to use for the investigation. The 1st and last thickness’ of the wire constantan were taken and the proposed method was practiced. But this time, another result was recorded. The time it took for the wire to get hot was recorded. This was done so that we would have a better idea of how long it took the wire to heat up, and when would we need to turn the power supply off. If the wire was to heat up the results could be affected.
Here are the results:
Time taken for wire to heat up (sec)
From these results we can see that the thicker the wire the longer it took for the wire to heat up. This is because there are more metal ions to heat so therefore it takes longer. These results have given us a good idea of how long the power supply can be left on before the results will be affected. The time it takes for the other thickness’ of wire to heat will increase as the wire gets thicker.
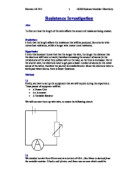
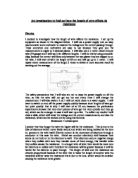
Method
The above circuit was set up at room temperature. A voltmeter was used to measure the potential difference of the wire and an ammeter was used to measure the current. 90 cm of the 1st thickness of constantan was placed into the circuit, the power supply was turned on and the current and potential differences were measured. The experiment was done 3 times and an average resistance was found. The power supply was only on for a few seconds, (the time it took to get a result). It was then quickly turned off to prevent the wire from heating up and the results from being affected. It was also done for our safety. This was done for all the different thickness’ of constantan. Each time the equipment was used safely and care was taken when obtaining the results.
To find the resistance this equation was used:
R (Ohm) = V (v) / I (A)
Results
Conclusion
From this investigation we have found that the thicker the wire, the less resistance there is. This has happened because the thicker the wire was, the larger the surface area of the wire, which means there were more electrons on the surface of the wire and therefore more electrons available to flow through the wire and produce an electric current. The more electrons there were on the surface of the wire, the bigger the current produced was and the bigger the force of the current. Also the thicker the wire the more room there is for the electrons to flow. We found that the resistance is lower when the force of the electrons is bigger as the electrons will be travelling through the wire with such a force that the resistance will be reduced.
Graph 1 displays the results, and produces an inverse curve. This shows that there is an inverse relationship. As the thickness of the wire increases, the resistance decreases. This shows that resistance is not proportional to the thickness of the wire. Another graph is drawn to try and find what the resistance is proportional to.
Graph 2 shows resistance against 1/thickness. An increasing relationship is found and a curve is still produced. This means that resistance is not proportional to 1/thickness. Another graph is drawn.
Graph 3 shows a straight line through the origin. Proving that resistance is proportional to 1/thickness squared. Resistance is inversely proportional to thickness squared. This is because thickness squared is roughly the surface area of the wire. So resistance is inversely proportional to the surface area of the wire.
Evaluation
As you can see from the results table there where no obvious anomalous points. The voltage was varied to show that V/I was constant if the temperature didn’t change. The length of the wire was kept the same for each test. The experiment was repeated three times to get a more accurate average and each time the test was repeated the same piece of wire was used. The same type of wire was used throughout the investigation. The variation also helped produce a more accurate average. The evidence obtained is good enough to support a firm conclusion. A micrometer screw gauge was used to measure the thickness of the wire.
I think the experiments done were quite accurate, although I think more could have been done to prevent the wire from heating up. We could have timed how long the power supply had been left on more accurately so that, by using our preliminary work, we could have been able to predict more accurately when the wire was getting hot, and therefore when the results could have been effected.