An investigation of factors which might affect the rate of the reaction between sodium thiosulphate solution and dilute hydrochloric acid
Title
An investigation of factors which might affect the rate of the reaction between sodium thiosulphate solution and dilute hydrochloric acid
Introduction
To investigate the factors, which might affect the rate of the reaction between sodium thiosulphate solution and dilute hydrochloric acid I will use the equation for the reaction occurring, which is:
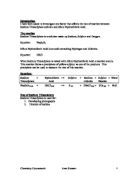
The word equation,
Sodium thiosulphate + Hydrochloric acid Sodium Chloride +
Water + sulphur dioxide + sulphur
The symbol equation is,
Na2S2O3 (aq) + 2HCl (aq) 2NaCl (aq) + H2O (aq) SO2 (g) + S (s)
We can see from the equation that one of the products formed is sulphur. Sulphur is a solid and is insoluble in water. As a result it appears as a precipitate, suspended in the reaction mixture. This precipitated sulphur causes the reaction mixture to become cloudy. As the reaction proceeds the reaction mixture becomes progressively more cloudy until eventually the 'X' used in the experiment is obscured. We use the time taken for the 'X' to be obscured as a measure of the rate of the reaction.
What do I want to find out?
During this investigation there are a number of problems I hope to solve. I hope to find out the factors, which affect the rate of the reaction between sodium thiosulphate solution and dilute hydrochloric acid. Some of these factors are shown below:
* The concentration of sodium thiosulphate solution
* The concentration of dilute hydrochloric acid
* The temperature of the reaction mixture
* The volume of the reaction mixture
* The size and colour of the 'X'
In my coursework I will be investigating only two of the above factors. I will be investigating the effect of varying:
* The temperature of the reaction mixture
* The concentration of hydrochloric acid
These two factors will be my Independent variables
The Dependant variables will be the rate of the reaction
Plan
for
experiment
one
Apparatus
For this first experiment (varying the temperature of the reaction mixture) I will need;
* 3 100cm3 beakers
* Measuring cylinder
* Filter paper
* Dilute hydrochloric acid (0.5 molar)
* Sodium thiosulphate solution (0.1 molar)
* Stop clock
* Boiling tubes
* Goggles
* Thermometer
* Test tube rack
* Water
All of the above apparatus is needed for my first experiment.
Diagram
Results
for
experiment
one
Method
To complete this experiment, I firstly have to collect the apparatus.
I will then label two of the three 100cm3 beakers, one will have the label HCl (aq) on it, the other will have Na2S2O3 (aq) on it. I do this so I can tell which beaker is which.
I also have to label the two measuring cylinders in the same way as before.
Now that I can tell the difference between my different beakers and measuring cylinders, which contain different solutions, I can now measure out 25cm3 of each solution. I will mark the filter paper with an 'X' in the centre and set the third 100cm3 beaker on to of the filter paper and the 'X'.
I will then add the sodium thiosulphate solution to the beaker and then the hydrochloric acid, at this point I will start the stopwatch and time the reaction until the 'X' is obscured from view.
When I can no longer see the 'X' then I will stop the clock and record my results.
I feel this is a fairly accurate way of recording my results although it does rely on the accuracy of my eyes and how fast I can start and stop the watch.
After I have collected my results then I ...
This is a preview of the whole essay
I will then add the sodium thiosulphate solution to the beaker and then the hydrochloric acid, at this point I will start the stopwatch and time the reaction until the 'X' is obscured from view.
When I can no longer see the 'X' then I will stop the clock and record my results.
I feel this is a fairly accurate way of recording my results although it does rely on the accuracy of my eyes and how fast I can start and stop the watch.
After I have collected my results then I can produce some graphs for my experiments, for my first experiment the graphs will be
* Temperature oC against time in sec
* Temperature oC against 1/T
The first graph will measure the
/T will measure the rate of the reaction
Results
When I collect the results I will have to arrange them into a table. The table will consist of five columns. I have designed a blank table shown below:
Temp oC First time sec Second time oC Average time 1/T
After I complete this experiment I can fill out this table which will then enable me to draw graphs.
Results
When I complete my second experiment I will have to complete a results table showing my results, the table is shown below.
Conc' First time Second time Average time 1/T
Of HCl Sec Sec
After I complete my results I can fill this table and then draw my graph.
What can be seen from this graph?
From this first graph I have drawn, temperature against time, I can see the following that as the temperature increases the time decreases.
This agrees with my hypothesis, which I stated earlier in my plan.
Generally I am happy with my results for this graph because I don't have any points off the curve, I do realise that I could have received a better curve, with all of the points all joining easily, but this graph clearly shows me that as the temperature increases the time decreases.
I will now draw my second graph and compare the results.
What can be seen from my second graph?
After completing my second graph of temperature against 1/T, I can see that I did not receive a straight line but if I draw a line of best fit, I can see that the results do fall closely to the line.
This also agrees with my hypothesis, which I stated earlier in my plan.
Again I am generally pleased with these results, but there is one point, which is slightly away from the line, this could have been due to one of many factors, some of these factors could have been,
* A slight difference in the temperature that the others
* An inaccurate reading from the reaction
These are only two of many possibilities, and off course if I had more time I could go back and redo this part of the investigation, but unfortunately I don't have much time and therefore I can't.
What can be seen from this graph?
In this second experiment I was investigation the effect of varying the concentration of hydrochloric acid. After I found the results I was able to plot a graph of
Plan
for
experiment
two
Method
To complete this second experiment I have to collect the apparatus, which is listed overleaf.
I will be using the same labelled beakers and measuring cylinders as before, which the same labels on then.
After I have my apparatus collected, I will measure out 25cm3 of HCl and 25cm3 of Na2S2O3 and add them together in the third 100cm3 beaker.
I will do this again with 5cm3 H2O, 20cm3 HCl and 25cm3 Na2S2O3. I will add the H2O and HCl together and then add this to the sodium thiosulphate solution.
I will again do this only with, 10cm3 of H2O and 15cm3 HCl and 25cm3 of Na2S2O3. And mix as before.
Again, I will add 15cm3 of H2o and 10cm3 HCl with 25cm3 of Na2S2O3, and mix as before.
I will continue doing this until I am using 20cm3 H2O and 5cm3 HCl with 25cm3 of Na2S2O3.
Again as before I will put an 'X' on a piece of filter paper and set the beaker on top. I will measure the reaction time, until I can not see the 'X' anymore.
After I have collected my results I can produce some tables to show my results and produce some graphs to show the rate of the reaction.
These graphs will be:
* Concentration, cm3 against time in sec
* Concentration, cm3 against 1/T
Apparatus
To complete this second experiment will need:
* 3 100cm3 beakers
* Two measuring cylinders, 1 25cm3 and 1 10cm3
* Filter paper
* Dilute hydrochloric acid solution (0.5 molar)
* Sodium thiosulphate solution (0.1 molar)
* Water
* Boiling tubes
* Goggles
* Test tube rack
* Stop clock
All of this apparatus is needed for this second experiment, varying the concentration of HCl
Results
for
experiment
two
Controlled variables
The controlled variables in this experiment are:
* The concentration of HCl
* The concentration of Na2S2O3
* The size and colour of the 'X'
* The size of the reaction vessel
* The volume of solutions
All of these things will not change while the following will:
* The temperature of the reaction mixture
* The reaction time
These changeable factors are known as the Independent variables
Controlled Variables
The controlled variables in this second experiment are:
* The concentration of Na2S2O3
* The temperature of the reaction mixture
* The size and colour of the 'X'
* The volume of the reaction mixture
* The size of the reaction vessel
All of the above are known as the controlled variables and will not change, while all of the following will:
* The concentration of HCl
* The reaction time
These factors are known as the Independent Variables
Evaluations
for
experiment
one
Evaluations
for
experiment
two
Results
After completing this investigation, varying the temperature of the reaction mixture, I have been able to collect some results. I then put these results into the form of a table and two graphs, the graphs are:
Graph of temperature in oC against time in seconds
And, Temperature in oC against 1/T
These graphs have enabled me to conclude this experiment.
My results can be seen on the following page.
Results
After completing this second experiment, varying the concentration of hydrochloric acid, I have been able to collect my results. I then put these results into the form of a table and two graphs, these graphs are:
Graph of varying the concentration of HCl, in cm3 against time in sec
And, varying the concentration of HCl, in cm3 against 1/T
These results have enabled me to conclude this experiment.
The results can be seen on the following pages.
Hypothesis
I predict for this experiment, varying the temperature of the reaction mixture, as the temperature increases the time will decrease.
The collision theory has led me to this hypothesis.
The theory stated that as reactant molecules heat up the bonds between them break and weaken, the atoms re-arrange themselves, and new partly bonds are formed. The potential energy increases at this point because:
* The approaching reactant molecules must overcome the mutual repulsive forces between the outer shell electrons of their constituent atoms
* Atoms must be separated form each other as bonds are broken.
The diagram below shows the binds breaking and molecules moving more freely
All of this movement causes heat to be produced and as this happens the proportion of reactants species that can react the potential energy maximum increases, increasing the number of product molecules that are formed each second, increasing the rate of the reaction.
Hypothesis
In this second experiment, varying the concentration of HCl I predict that as the concentration of HCl increases the time will decrease.
What can be seen from this graph?
After plotting the graph of time, in seconds, against concentration of HCl, in cm3, I can see that as the concentration of HCl increases the time decreases, this agrees with my initial prediction.
I feel I have received quite pleasing results, unlike my first experiment where I had one plot off the line, this time I have none. I realise my results could always be more accurate by using different techniques of measuring out the concentrations or measuring the rate of the reaction.
Perhaps if I had more time I could repeat the experiment and see if my results differ any.
What can be seen from this second graph?
The second graph I plotted the concentration of HCl against 1/T.
This graph shows that as the concentration of HCl increases 1/T also increases.
I drew a line of best fit through the results showing that the plots fall on both sides of the line. Again I feel I have received good results because I don't have any plots which are off the line by much. This could be improved by having more plots closer to the line or even on it. This would show even more clearly the results, which I found.
I could improve these results by repeating the experiment.
Evaluation
After completing this first experiment, recording the results and plotting the graphs, I can see that my initial hypothesis.
I now know that in this experiment, of varying the temperature, the temperature will increase and the time will decrease.
I noticed that on my second graph I had one point off, this anomaly could have been due to one of many factors. I could have repeated this one part to find a new result which would have been a better result and improved my graph, if I had time I would have done this, but unfortunately I don't.
I am pleased with my results for this investigation although the one point out does make the results seem inaccurate.
Evaluation
After completing this second investigation, varying the concentration of HCl I can see that I have obtained pleasing results. I realise I could have varied the concentration of Sodium thiosulphate solution, but instead I used hydrochloric acid. I think I could have used either of these solutions but I choose to investigate varying the concentration of HCl.
In my results I found that there was no points out like the first graph, but still I know these results could always be made more accurate, by finding a new way of recording the rate of the reactions. This is one of many ways, which I could have used to improve the experiment.
I found that my hypothesis was correct and my graphs were fairly accurate.
Conclusion
After completing this investigation I have found that, in relation to my initial problem, I choose and investigated two factors, which might affect the rate of the reaction between sodium thiosulphate solution and Hydrochloric acid.
The two factors I choose were,
Varying the temperature of the reaction mixture,
Varying the concentration Hydrochloric acid
After investigating these factors we can now see that these are tow factors which could affect the rate of the reaction, I investigated these factors quite thoroughly and found many results which are generally quite pleasing.
In conclusion I have found two factors which could affect this reaction and investigated them.