The equation for photosynthesis is:
Carbon dioxide + water glucose + oxygen
6CO2 + 6HO2 C6H12O6 + 6O2
the equation shows that glucose and oxygen are made in the process of photosynthesis. Therefore the rate of photosynthesis can be found by the amount of glucose or oxygen produced. Because oxygen is let out of the plant, this will be the easiest of the two to measure. I will measure the amount of oxygen made by the number of bubbles given off from the plant.
Preliminary experiments:
In my preliminary experiment I learnt what to expect for the real experiment so this prepared me in many ways. From my preliminary experiments I discovered that I should not have the lamp any closer the 5cm because the light intensity is beyond the light saturation point so there was no change in the results and that the light will begin to heat the water bath making it inaccurate. I also found that there was not much point in having the lamp any further away than 70cm because very little photosynthesis occurred. My range of results will be from 5cm to 70cm. I found that the pondweed had to be put in upside-down as that is where the bubbles come out of. The pondweed shouldn’t be touching the side because otherwise the bubbles sometimes gets trapped. The pondweed should also be placed a fair distance below the water so that when there is a bubble it can be seen clearly. These all helped me design my final method.
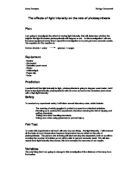
Diagram:
Apparatus:
Test tube, beaker, clamp and stand, pondweed, thermometer, ruler, lamp, stopwatch, sodium hydrogen carbonate solution, water, scalpel
Method:
The equipment was collected and set up a shown in the diagram. The strand of the pondweed was cut from the main plant at an angle with a scalpel. This was put in the test tube which is filled with 6ml of water and 6ml of sodium hydrogen carbonate solution. The test tube was put into the water bath so the temperature remained constant. The thermometer was put in the water bath to check that the temperature did stay the same. The clamp and stand was used to keep the test tube upright. The lamp, to begin with, was put 10cm away from the plant (this was measured by the ruler). The plant was left to climatise for 5minutes so the results were more accurate. The stopwatch was started and the bubbles produced by the plant by photosynthesis were counted. After 1minute the number of bubbles were recorded. The temperature was recorded at the beginning and end. This was repeated another two times so that an average of the results could be found. The whole process was done again but the light was 20cm away, then 30cm, 40cm, 50cm and finally 60cm.
Theory:
In order for photosynthesis to happen light is needed. The more sunlight there is then the more the plant will photosynthesise because the light is the input energy put into the process (it is transformed into chemical energy). The reaction is endothermic so light is needed. But there comes a point where more light does not make any difference to the rate of photosynthesis because the light is at the light saturation point and photosynthesis occurs at the same speed even with more light because it has reached the optimum amount. The rate of photosynthesis cannot speed up because there is only a certain number of chloroplasts containing a limiting amount of chlorophyll and this can only absorb a certain amount of light. The rate of reaction to the light intensity is inversely proportional 1/d2.
Prediction:
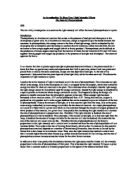
I predict that the closer the lamp is to pondweed the faster photosynthesis will take place because light is needed for the reaction and there will be more input energy. The rate of photosynthesis to the light intensity is inversely proportional so it will increase rapidly at first but will not increases so rapidly when the lamp gets closer to the pondweed. When the lamp gets close to the pondweed the lamp will be giving all the light (energy) that the pondweed will need to photosynthesise at its optimum speed. It cannot photosynthesise any faster because there is only a certain number of chloroplasts containing a limiting amount of chlorophyll and this can only absorb a certain amount of light which is called the light saturation point. I think that the light saturation point will be at about 15cm judging by my preliminaries. The other limiting factors should be at their optimum or remain constant throughout the experiment and so should not affect the experiment. I predict that the graph of results will look something like this:
Rate of p/s
Light intensity
Analysis:
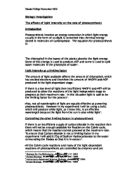
My graphs show that, at first, the rate of photosynthesis increases rapidly and steadily, at light intensity 5 the bubble rate is 2 but at light intensity 30 the bubble rate is 12. More light intensity produces a faster rate of photosynthesis because more light energy can be trapped in the chlorophyll which is needed for the reaction. When it reaches a light intensity of about 30 this it doesn’t increase so rapidly and steadily the graph shows a curve. By the time the light intensity reaches 400 the line on the graph is almost flat. This point is the light saturation point (where more light does not affect the rate of photosynthesis because all of the chlorophyll is being used to trap the sunlight.
From these results I can conclude that the more light intensity (sunlight) the faster plants can photosynthesise until a certain point when they photosynthesise the same amount even with more sunlight. This is the light saturation point, the rate of photosynthesis can not improve with more light because it already has as much light as it needs.
The plants photosynthesise faster with more light because energy is needed for the reaction and light is the energy.
My results do agree with my predictions: I predicted that more light would speed up the rate of photosynthesis, I predicted that the rate of photosynthesis would not increase so rapidly when the lamp got closer (light saturation point). I did not predict correctly what distance the light saturation point will be, the light saturation point turned out to be closer than I had predicted by about 10cm. This is because the plant was not photosynthesising as well as in the preliminary experiments.
My predicted graph and actual graph are very similar in shape although in the actual graph the rate of photosynthesis goes up steeper than I had predicted.
Evaluation:
The procedure that I used was accurate enough for me to come up with good results and strong conclusions. I could identify trends and patterns in the graph that I had in my predicted graph. Because I can come to these conclusions the experiment was a success.
I have one anomalous result which was at 15cm, this result is probably anomalous because the temperature dropped by 1°Cfor this distance or it became cloudier and darker outside affecting the amount of light reaching the plant.
In my experiment there were a few things that may have made my results less accurate. I could have miscounted the number of bubbles or gone a few seconds longer than I was meant to because it is difficult to look at two things at once. The variables were controlled reasonably well, the amount of water and chloroplasts kept constant, the temperature was controlled quite well in a water bath with the exception with one or two distances, the amount of carbon dioxide was kept constant until the end when the amount of carbon dioxide may have reduced because the sodium hydrogen carbonate solution may have ran out a little, the light intensity might have changed a bit because of the varying sunlight coming in the windows. The sunlight could have been controlled by closing the blinds on the windows. The temperature could have been controlled better by having a bigger water bath.
The method of counting bubbles was probably not very accurate because the bubbles can be of different sizes, this can be improved by leaving the plant to photosynthesise for longer and then the volume of oxygen given off can be measured. The experiment will be done as follows.
If I had more time to do the experiment I would have done more repeats to get more accurate results and I would have done more experiments with the light intensity at 100 – 400 because this would have improved the line on my graph. This would have given more evidence which would give me a better idea of where to draw the line of best fit.
My evidence is sufficient enough to support my conclusion and it agrees with my theory so they must be quite accurate.
To extend my investigation to obtain additional evidence I could use more sophisticated equipment like a photosynthometer to measure the rate of photosynthesis. I could also change one of the other variables such as temperature: I would do the same experiment except the lamp would be kept in the same place and the water bath would be gently heated at different temperatures.