Area = π R2
Where R = Radius
Example-
If the radius of wire was doubled from 1mm to 2mm then the cross-sectional area is quadrupled this would mean that the resistance is quartered as resistance is inversely proportional to cross-sectional area.
Length – If the length of a piece of wire was to increase in theory the resistance of the wire should also increase.
For example- if the length of the wire was doubled in theory the resistance should also double because the electrons will have twice as long to travel
+++++++++++++++++++++++++++++++++++++++
When I am doing the experiment I will change just one factor, I will have to take into consideration which I can measure with the most accuracy and ease with the equipment available.
If I was to change the cross-sectional area of the wire it would be very hard to measure this in the school lab and even using a micrometer the percentage error of the results would be larger, I would also need a range of wires of identical material but varying diameters, and to be able to draw a graph for my results I would need a range of at least 5 and to be very accurate at least 10.
If I was to change the length of the wire this would be simpler and the percentage error would be less, especially if I stuck to longer lengths. I would also be able to use the same piece of wire for the whole experiment which would make the experiment fairer.
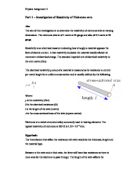
How I will calculate Resistivity
By changing just one factor in the equation I will be able to calculate the Resistivity.
R = ρ L/A
I will be changing the length of the wire because it’s the easiest to measure with accuracy.
I will connect the piece of wire into a series circuit with a set power supply and measure the current of the circuit when the length of test wire is changed, I will also measure the P.D. of the test wire, with the results for length of test wire, circuit current and voltage, I will be able to calculate the resistance with the equation-
Resistance (Ω) = Voltage (V)
Current (A)
I will also calculate the error in reading for the voltmeter and ammeter and I will be able to draw a graph for length against resistance with error bars, I will then be able to draw a line of best fit for the graph witch should cross through all the error bars.
The line on the graph should be a straight line with the formula-
y = m x + c
Where ‘m’ is the gradient of the line, this formula can be compared with the formula for Resistivity-
y = m x + c
R = ρ l
A
From the two equations I am able to tell that gradient = ρ/A, which can be rearranged to-
ρ = m × A
With my results for gradient and cross-sectional area I can the calculate the final result for Resistivity, I will also be able to
Apparatus
- Power-Pack
- Digital variable Ammeter
- Digital voltmeter
- Circuit wires
- Crocodile clips
- 1 meter length of test wire
- Meter ruler in 1mm increments
- Micro-meter
- Electrical tape
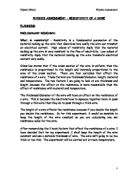
Circuit Diagram
3v
A
V
Test Wire
Electrical Wire
Crocodile Clip
A Ammeter
V Voltmeter
Diagram
Method
Firstly I will do a test run on a selection of wires to see which is the most suitable.
- Measure out 1m of the selected wire and tape is so it is streaked out and raised above the work surface so there are no kinks also clean the wire so a good connection can be made between the crocodile clips and the wire.
- With a micrometer record the diameter of the wire in five places along the wire, these can be used to calculate an average radius of the wire which will be used to calculate the cross-sectional area of the wire.
- Set up the circuit as shown in the circuit diagram setting the power-pack to 3v DC.
- Connect the left crocodile clip to one end of the wire and with the meter ruler measure out the selected length along the test wire and connect the right crocodile clip.
- Quickly record the reading on the ammeter and voltmeter, then disconnect the circuit.
- Allow the wire 30 seconds to cool before recording the next result.
Constants in the Experiment
To ensure fair results I must-
- Use the same equipment for the whole experiment, which includes- ammeter, voltmeter, circuit wires, crocodile clips, ruler and power-pack.
- Use the same piece of wire for the whole experiment as different pieces of wire can change in composition and size of cross-sectional area.
- Use the same power supply to the circuit, this will be kept constant at 3v DC.
- Keep the wire temperate constant, as heat affects resistance of a material, this will be done by using a small circuit voltage and allowing the wire time to cool to room temperature, (which will also be constant) between each test.
Wire = 0.315
Measures = …………..
Power pack = 2x 1.5v cells
Safety Precautions
- Keep a low voltage on the power pack (about 3v) as this will stop the wire from heating up, also don’t touch the wire when the power is connected as it may be hot.
- Be careful when cutting and handling the wire.
Results
Table of results collected from experiment-
Tables of results to show highest and lowest values for Resistance when taking into account percentage errors-
Lower Values – using highest possible values for current and lowest possible values of voltage, within the percentage error for the apparatus, with the formula-
R (Lowest possible value) = V (value + 0.01)
I (value – 0.01)
Upper Values – using lowest possible values for current and highest possible values of voltage, within the percentage error for the apparatus, with the formula-
R (Highest possible value) = V (value – 0.01)
I (value + 0.01)
I can now calculate the difference between the low and high values for resistance
Table to show the results of average, lowest possible and highest possible results for Resistance with difference between lowest and highest values-
The table shows that the difference between the high and low calculations for resistance increases as the
Error Bars
I will be able to plot a graph showing the error in reading on the instruments, the difference between lowest and highest values will be the height of the error bars on the graph and the average will be the mid-point for the error-bar the width of the error bar will be much simpler, as this will just be the error reading the meter ruler
Graph Gradients
Upper Gradient =
Mid Gradient =
Lower Gradient =
Cross-sectional Area of Test-wire
I measure the wire in five different places with a micrometer along the 1m section I was using. I will then be able to calculate the cross-sectional area of the wire using the formula-
Area = π r2
As my measurement of the wires diameter is in mm I must divide the answer by 1000 to get metres.
Results-
Radius of test wire = 0.318 +/- 0.01 mm (to 4 s.f.)
Upper Cross-Sectional Area-
π × ((0.328/2)/1000)2 = 8.44×10⁻⁸m2 (to 3 s.f.)
Lower Cross-Sectional Area
π × ((0.308/2)/1000)2 = 7.44×10⁻⁸m2 (to 3 s.f.)
Actual Cross-Sectional Area = Upper Value + Lower Value / 2
Actual Cross-Sectional Area = 7.94×10⁻⁸m2 +/- 0.5×10⁻⁸m2 (to 3 s.f.)
Resistivity
Upper Value = ρ = m (upper value) × A (Upper value)
Upper Value = ? × 8.44×10-8 =
Lower Value = ρ = m (lower value) × A (lower value)
Lower Value = ? × 7.44×10-8 =
Actual Resistivity = Lower Value + Upper Value × 2
Actual Resistivity =