Equipment
250ml beaker
Large plastic bowl
2x 50ml measuring cylinders
2 Volume hydrogen peroxide (~300ml)
Thermometer
Bunsen burner, tripod, gauze, heatproof mat
Ice cubes
Scalpel
50g of liver or 15x2.5g pieces
Boiling tube
Bung and delivery tube
Balance
White tile
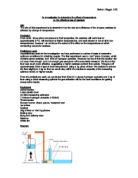
Diagram
Plan
First, the equipment will be set up, a large bowl of water will be filled to about 10cm deep, enough to submerge a beehive shelf. Then a water bath will be prepared containing 50ml of water, and placed on the tripod. One of the measuring cylinders will be filled with water and it’s end submerged in the bowl, so as not to let any air into it. It will then be put on top of the submerged beehive shelf and the delivery tube fed through the beehive shelf and into the measuring cylinder. This will mean that any gas collected by the delivery tube will displace some of the water from the measuring cylinder and the volume of gas can be measured. Then a boiling tube will be taken and 20ml of hydrogen peroxide measured out into it using the other measuring cylinder. The boiling tube will be bunged with a closed bung to stop the hydrogen peroxide reacting prematurely. The test tube is then placed into the water bath to bring it to the same temperature. The thermometer is also placed into the water bath. A 2.5g piece of liver will be cut on a white tile. The water bath will then need to be brought to the correct temperature. We will be investigating five different temperatures in increments of 10°C from 10-50°C. The first temperature, 10°C, will be achieved by adding ice cubes to the water bath. When the water bath has reached the desired temperature the bung will be removed from the boiling tube, and the liver fully submerged in the hydrogen peroxide. The other bung (attached to the delivery tube for gas collection) is used to bung the boiling tube quickly and the stopwatch or stopclock will be started. Our preliminary work showed that 30 seconds should not fill the measuring cylinder but will let slower reactions react enough to be measured, so after 30 seconds the reading will be taken on the measuring cylinder and recorded. This experiment will be repeated three times to get an accurate average and three more times at each temperature. For those temperatures warmer than room temperature, the Bunsen burner will be lit and the water bath warmed slowly to the right temperature, it will be warmed slowly to ensure that the thermometer keeps up with the current temperature.
Variables
We are investigating the temperature variable and its effects, but other variables are:
Weight of liver Surface area of liver amount of H2O2
Time left Concentration of H2O2
Fair Test
In order to maintain a fair test, we will perform each experiment three times to get a fair average and to make it easier to see anomalous results. We will also try to keep all of the variables listed the same through all experiments
Results
Analysis
The volume of gas given off at different temperatures was very clearly different. At 10°C and 20°C the enzymes seem to be very slow to function, and the highest results are given at 50°C. The difference between 50°C and 60°C is however much less than the difference between 40°C and 50°C, and this is visible on the graph as the curve begins to level. This suggests that if we had continued beyond 50°C the gas given may have started to drop.
In all cases the three tests for the same temperature gave very similar results, suggesting reliable and accurate results from which to draw a conclusion.
Conclusion
After analysis of the results I can conclude that my prediction was mostly correct. The optimum temperature was however closer to 50°C than 40°C, which is contrary to my prediction. I think the optimum temperature for the catalase may have been slightly lower than 50°C, and by 50°C the enzymes were beginning to denature, which would explain the smaller difference. However without testing 60°C (a higher volume of gas than at 50°C would disprove this theory) or testing between 45°C and 50°C (a higher volume of gas would suggest this theory is correct) I have no results to back this up. Based on my current knowledge of the function of enzymes, I do not think the increase in effectiveness due to a raise in temperature would begin to slow until the enzymes denatured, or at least began to denature. Also the optimum temperature should be around the body temperature of the animal, as this would define its natural conditions.
If we extrapolate our current results on the graph, the optimum temperature would have been between 55°C and 60°C, however with just the results of 50°C and 60°C we cannot tell what would have happened in between, and if an optimum was reached.
The lower temperatures show that catalase has very little effectiveness below 30°C. This is consistent with the fact that under operating conditions in the liver, they would never become this cold.
Evaluation
There were a number of factors that could have affected our results that we did not intend, firstly we only used a 50ml measuring cylinder, and some of the volumes of gas given off were above 50ml, so we had to estimate the overflow. I think this was done accurately, however and so no significant impact would have been made on the accuracy of our results. Secondly after the experiments at 20°C the 2 volume H2O2 was depleted, so we had to dilute 10 volume H2O2 to the correct concentration. There is a significant increase in gas given off between 20°C and 30°C so it is possible that this new hydrogen peroxide was of a higher concentration than intended.
Overall though I think we obtained clear results that followed a good pattern and agreed with our predictions, and the experiment therefore went well. Improvements we could have made would have been to test a wider range of temperatures so that we could obtain a more accurate optimum temperature, through to when the enzymes totally denature.