The results produced by the preliminary work clearly showed that the experiment must be repeated several times (discarding any obvious faulty results), as there was little correlation, to gain more reliable, average results
Variables
The independent variable will be the changing of concentration of the sucrose solution surrounding the potato strips. The values chosen for the concentrations will range from 0.0M to 1.0M and will include 0.0, 0.1, 0.3, 0.5, 0.7, and 1.0M. These values will produce six points on a graph allowing an accurate line to be drawn.
The dependent variable will be the length of the potato strips. After the experiment there lengths will be recorded. These results can then be plotted on a graph against concentration.
Other variables, which may influence the results, include: -
· Surface Area of the potato strip
· Original Length of potato strip
· Amount of light exposure
· Temperature
· Time spent in the solution
These variables must be controlled in order to create a fair test i.e. each potato strip must be subjected to the same procedure and conditions as to not effect the results. Using a cork borer to slice potato strips of equal widths will control surface area. Each strip will then be cut to 40mm (to the nearest mm) to make certain they have matching lengths. Temperature and light will be kept constant by placing the petri dishes in a controlled environment of no light and at room temperature. Any difference in time that the potato strips spend in the solutions will be held to a minimum by placing and removing them within a small space in time.
Apparatus
1x Scalpel 1x Slate
1x Wooden rod 1x 30cm ruler
1x Cork Borer (size 6) 1x 30cm2 plastic sheet
1x Large potato 200ml of distilled water
6x Petri dish 200ml of 1M sucrose solution
2x 200ml beakers 1x marker pen
2x 10ml measuring cylinders 1x 100ml measuring cylinder
2x Pipette
Method
1) Fill one beaker with 200ml of distilled water and one with 200ml of 1M sucrose solution.
2) Using the table below fill each petri dish with its required volumes of sucrose and water replacing the lids to prevent evaporation. Mark each dish with its concentration.
3) Slice 18 potato strips from the potato using the cork borer cutting each to 40mm long. Cut the potato on the slate to prevent any damage to the table. After cutting each cylinder place them under the plastic sheet to stop the evaporation of water.
4) Mix the solutions and place three potato strips in each petri dish (ensuring they are not touching), replace the lids, and leave them in a cupboard for 24 hours.
5) After the 24 hours remove the potato strips from the petri dishes and measure each one. Recorded these measurements in a table with the following headings: -
6) Repeat steps 1-5 five times.
Analysing Results
After the results have been recorded from each repeated experiment they will be compiled into a single table: -
Change in length is found by using the formula: -
Change in length = Average Length – Original length
Change in length can then be plotted on a graph against concentration. Page 5 shows a similar graph with an estimated best-fit line. The point at which this line cuts the x-axis is the point of equilibrium i.e. where there is no change in length and therefore the water potential of the cell equals the water potential of the solution at that point. The concentration reading can then be converted into a value of water potential using a conversion table.
Risk assessment
The only area which my present some risk is the cutting up of the potato. Great care must be taken when using the cork borer and scalpel to avoid injury. It may also be advisable to wear a lab coat to protect clothing from any solutions.
References
Cambridge Advanced Sciences Biology 1
Investigating Osmosis
Osmosis is the movement of water molecules across a partially permeable membrane from a region of high water concentration to a region of low water concentration. It can be affected by several different variables including concentration of sugars. In this investigation I will be exploring the effect of varying concentration of sucrose sugar solution on the amount of osmotic activity between the solution and the potato chip of a given size.
Osmosis is basically a special kind of diffusion involving water molecules, which occurs when two solutions are separated by a partially permeable membrane. The water diffuses from the weaker solution to the stronger solution. Tiny holes in the membrane allow small water molecules to pass through, but the glucose molecules are too large to pass through the semi- permeable membrane.
Plant cells have a cell wall surrounding them, this is very strong. When they take in water by osmosis they begin to swell, but the cell wall stops them bursting. Plant cells become swollen and hard when they are put in dilute solutions. The pressure inside the cell will rise and eventually is so high no more water can enter the cell. This works against osmosis. But being like this is very important to plants, as it is what makes the green parts of them stand up in the sunlight. When plant cells are placed in concentrated sugar solutions they lose water by osmosis and they become weak and thin, because the sugar is more concentrated outside the plant than in the plant itself. The insides of the potato cells shrink and pull away from the cell wall. When plant cells are placed in a solution, which has exactly the same osmotic strength as the cells they are in a state between swollen and hard and weak and thin.
Many variables effect osmosis. These variables include:
- Temperature
- Volume of sugar solution
- Concentration
- Weight of potato
- Surface area
I have chosen to change the concentration because I hope this will give me a good varied set of results to work with. The concentration will be measured in molars.
To make sure this is a fair test I will have to keep all the variables constant apart from the concentration. If I did change one of these variables, for example, if one potato chip were 1cm longer than the other there would be more space for osmoses to occur, therefore the test would not be fair.
To make sure the test remains fair I will do all my experiments at room temperature, use the same type of potato, which will be kept at the same size and weight and have been treated in the same way. I will also use the same volume of the solution in the test tube is kept fair. I will use an accurate electronic balance, showing grams to 2dp in this experiment, to ensure even small changes in mass are recorded. I will also keep using this balance throughout the experiment so measurements do not vary due to any change that may be introduced by different scales.
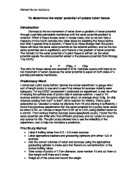
The water particles pass from a high concentration to a low concentration. I predict that the lower the concentration of the sugar solution in the test tube the larger the mass of potato will be. So in a high sugar concentration the potato will have a smaller mass.
This is what I think my graph will look like.
I will use a range of the sugar solutions from 0 molar to 10 molar in 2 molar steps. This should give me a good range of results to look at.
Apparatus
Apple corer – to cut circular potato pieces
Potatoes – to use to show osmosis
Kitchen towel – to dry potato pieces, so water does not make them weigh more, as this would not make it fair
5 test tubes – to put the solution in
Sucrose solutions – to put potatoes in, 5 different concentrations
Test tube rack – to put test tubes in
Pen, Paper and ruler - to record results
Electronic balance – to weigh potato pieces, gives a more accurate result than normal balance
Pipette – measure solution
Method
1. Take 2 similar sized main-crop potatoes.
2. Carefully use an apple corer to make circular sections approx. 2cms long.
3. Wash and dry all the pieces
4. Make a table to record results in. It should look something like this:
5. Weigh each potato piece on an electronic balance and make sure they are a similar mass. Do this for 3 pieces at a time to ensure pieces for each solution do not get mixed up. You need to keep all the pieces together so you can keep track of which masses go into each test tube. This is important to keep the experiment a fair test.
6. Take a test tube rack and place 5 test tubes in it. Label them 0 molars, 2 molars, 4molars, 6molars, 8molars and 10molars
7. Using a measuring cylinder measure and pipette out different amounts of the sucrose solution and distilled water, which is poured into the test tubes in a percentage ratio giving you the various molar concentrations.
8. Put 3 potato segments into each beaker and leave for 24hours.
9. Dry with kitchen towel and re-weigh each segment on an electronic balance.
10.Record the results then make an average.
11. Re do using a second set of potato chips.
I have repeated the experiment to check for consistency and also because it ensures the results are fair and allows me to have a more accurate view on the changes. I have also worked out averages because I only require one set of results. As I was working with averages a control was not needed.
Results
First set of results
Second set of results
Average
As the sugar concentration went up the mass change became smaller. When the sugar concentration was 10molars there was only a mass change of 0.05g but when it was pure water the was change was 0.25g. I predicted that the lower the concentration of the sugar solution in the test tube the larger the mass of potato would be. This prediction was correct and the investigation did what I expected.
My results have a pattern, as the percentage of sugar concentration increased the change in mass decreased. Even though this was a pattern the decrease was not particularly large at any certain time.
In my opinion this experiment was very successful. I managed to obtain a large quality of accurate results from which I was able to produce an informative graph. I think I took the right amount of results but taking more would of made it more accurate. The 1day time period was enough time to allow osmosis to occur but I could of easily gained similar results in a shorter time span. If I were to repeat the experiment I would try and find out the saturation point of the potato pieces. I had an adequate but creating more concentrations is a possibility if I was to repeat this experiment as I could produce a wider range of results.
I found preparing the sugar solution the most difficult part of my experiment because I could never be 100% sure I was using accurate amounts. A more accurate pipette would have been useful. In future I could have used a burette, which would have ensured that the amount of solution in the tube was more accurate. I could of also weighed each potato piece to a more accurate scale i.e to three of four decimal places.
My results were fine even though the exact results were not persistent for both attempts at the experiment. This cause was properly human, I may not have dried some potato pieces as well as other, and some would then have more excess water adding to the mass. If I repeat the experiment again I will look into finding some other way of drying the potatoes more thoroughly. However I think the experiment was very successful and I am pleased with the complete comparison of my results with the initial prediction I made.