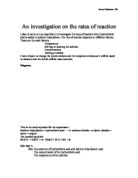
Preliminary Experiments:
To investigate the affect temperature has on reaction speeds I am going to use Sodium Thiosulphate and hydrochloric acid:
Sodium Thoisulphate + Hydrochloric Acid Sodium Chloride + Sulphur dioxide + Sulphur + Water
Na2S2O3 (aq) + 2HCL (aq) 2NaCl (aq) +SO2 (aq) + S (aq) + H2O (l)
Method: set up a Bunsen burner on a heatproof mat with a gauze. Measure out the Hydrochloric acid and Sodium Thiosulphate to the desired amount. Place a beaker of hydrochloric acid over a cross. Heat up the Sodium Thiosulphate and add to the beaker. Time how long it takes for the cross to disappear from view. I used this preliminary work to establish measurements to use for my actual experiment, and to decide on where precautions need to be taken to hold a safe experiment.
Results:
Conclusion: from this preliminary work I have established the basic methods of the experiment and I have been able to decide on the measurements to use of each product to produce a result that will be appropriate to gain accurate results. By diluting the Sodium Thiosulphate with water, the reaction takes longer, and therefore readings can be made easily. I can also use this to decide on the range of results I need to obtain.
Apparatus List:
Also required: stop watch, 2 measuring cylinders, safety glasses.
Detailed Plan:
Fill one measuring cylinder with 5ml hydrochloric acid, and another with 25ml of Sodium Thiosulphate and 25ml of water. It is important to keep these measurements the same throughout the experiment to keep the test fair because only one factor is being tested (temperature) and to make sure results are as accurate as possible, other factors must say the same.
Set up the Bunsen burner apparatus as shown in the diagram and set the Bunsen burner onto a blue flame.
Pour the 50ml of water and Sodium Thiosulphate into a beaker and heat to the desired temperature. Read what temperature it is using the thermometer.
Pour the 25ml of acid into the conical flask and place over a piece of paper with a cross drawn on.
When the water and sodium Thiosulphate has heated to the correct temperature, quickly pour it into the conical flask with the acid.
Time with a stopwatch how long it takes for the cross to be obscured by the products of the reaction.
Record your results and repeat 4 times to gain an average.
Repeat this experiment for 6 temperatures between 25°c and 50°c.
Tabulate your results.
Make sure that the sodium Thiosulphate and the hydrochloric acid are always measured in separate measuring cylinders to avoid the reaction occurring before heating.
Wash out the beaker after each experiment to keep the experiment fair.
Risk assessment:
To sustain safety you must make sure safety goggles are worn at all times and hair is tied back. Always keep the gangways clear, stay standing up during the experiment. Turn the Bunsen onto the safety orange flame when it is not in use, and when packing away, be aware that objects may be hot such as the tripod, gauze and Bunsen burner. Leave these to cool before moving them.
The products that are being used can be hazardous: hydrochloric acid (Hazcard 49) is corrosive, causes severe burns and irritation to the respiratory system. It is toxic by inhalation. Sodium Thiosuphate (Hazcard 93) has minimal hazards, but would be harmful if ingested in quantity. These precautions must be taken for personal safety, for the safety of others and to make sure the experiment is not disturbed.
Secondary sources: ‘Chemistry’ JA hunt and A Sykes
‘Key Science’ Eileen Ramsden
Results:
These results can be displayed clearly in two graphs, 1/time and time taken (see graph paper).
As can be seen from the results, as the temperature is increased the time taken for the cross to disappear decreases, or is more general terms, as the temperature is increased, the time taken for the reaction to complete increases. For example, when the temperature is increased from 25°c to 30°c, the time taken for the cross to be obstructed decreases by 13.315 seconds.
Conclusion
To conclude, it can be seen that as the temperature increases the time taken for the reaction to take place decreases. This means the rate of reaction increases as it takes less time for a reaction to take place, so more take place per second. From my graphs, trends and patterns can be seen. The graph displaying time against temperature shows a curve with a strong negative correlation, showing that a rise in temperature increases reaction speed. The graph showing 1/time against temperature is a straight-line graph. This graph has a strong, positive correlation and is used to show that time is inversely proportional to temperature. It can be seen that time is inversely proportional to the temperature or 1/time ∝ temperature.
For example: 1/9.4775 ∝ 50
1/13.485 ∝ 45
The experiment supports the original prediction. As was suggested in the prediction, the increase of the temperature increased the rate of the reaction. The graph did have a negative correlation and due to the rate of reaction not being exactly the same as the temperature is increased, it was curved. This can be explained by the collision theory. This states that when heated, particles gain more energy and move faster, increasing the chance of a collision, often with more energy. Particles with more kinetic (the kinetic theory states that matter is made up of small particles are constantly in motion and the higher the temperature the faster they move) energy after having a temperature increase become more likely to be overcome the activation energy and thus react far better.
It has been proven here that at a higher temperature, the articles have more kinetic energy. Moving through the solution more rapidly, they collide more often and more vigorously and so there is a greater chance that they will react. This is evident in the results with a consistent decrease of the time taken for the reaction to take place:
Thus, it can be seen that an increase in temperature increases the speed of reaction between Sodium Thiosulphate and Hydrochloric acid.
Evaluation
Accuracy: the results were accurate to a certain degree because there are patterns that suggests that they are correct, but as they do not fit exactly into correlation it is implied that there is room for improvement on the experiment.
Problems: there were problems and pitfalls in the experiment such as the human eye being decisive over whether the cross had disappeared, inaccuracies in measuring of the liquids, different crosses were used as the experiment was completed over two days, only one liquid was heated, the temperature could change from when the water and Sodium Thiosulphate was removed from above the Bunsen until it was added to the acid in the conical flask, and there were also inaccuracies with the timing of the experiment.
Anomalous results: There were no obvious anomalous results, but if reference is made to the graph, the result for 50°c (9.4775 seconds) does appear to be the most differentiating result from the line of best fit. It does appear to be too low, suggesting that the temperature could have been too high or a few collective mistakes could have been made especially surrounding human error, and the perception of whether the reaction was finished.
Changes: Changes that could be made to improve the accuracy of the results could be to use two Bunsen burners to heat both liquids, and to make sure the temperature was kept at the right level through the reaction, or a water bath could be used to keep a steady temperature. Another way of deciding if the cross had been obscured without using the human eye would provide better results, or if not, if two people decided together, the result would be fairer. Digital appliances would give better measurements than measuring cylinders, but this would mean weighing the liquids rather than using the volumes as measurements. More attempts would of course give a better average, which would also eliminate anomalous results as these could be spotted as incorrect as they would not fit in with the other results.
Is the evidence enough to support a conclusion? For this experiment it is enough to support a conclusion, but the evidence is not enough to explain all reaction rates as I have only investigated temperature. However, conclusions can be drawn for the range I have used (25°c - 50°c). The range could have been bigger as to provide a better-curved trend in the graph. From the range I have used I can predict a continuation of the curved correlation, with the line reaching ‘0’ on the time axis when the reaction touches and then falls below the activation energy. I would predict that the speed of reaction would continue to a point, but will not continue infinitely as it would become a limiting factor.
Further investigations: Obvious investigations to follow this would be to look into the other factors affecting a reaction such as concentration, surface area, pressure, and the addition of a catalyst, and then to move onto how if all put together, the most productive reaction could be made.