Air resistance will have a similar effect and as friction I can’t do much to alter it. I will have to keep the surface area of the trolley, which the resistance acts on equal all through the investigation.
After considering these points it is essential I use the same trolley and slope for the entire experiment. I will also have to keep the length of the slope constant, so the distance travelled which I will use to calculate the speeds is constant.
I must consider the ranges of height which I will vary. A difference in height of a few centimetres won’t have a real noticeable effect on the velocity. I will also have to keep the change in height constant.
I have decided to use trays/books to increase the height of the ramp. To obtain a collection of 5 or 6 values for speed, I will start with the ramp inclined at a height of 10cm and finish with a height of 60cm.
I will vary the height by 10cm each time remembering to keep all other variables and factors constant.
The equipment I will need to perform this experiment is listed as follows:
Slope: For the trolley to roll down
Trolley: To roll down the ramp
Metre Stick: To measure the height and length of the ramp
A stopwatch: To measure the time taken for the trolley to reach the bottom of the ramp
Barrier: To stop the trolley once it reaches the bottom of the ramp
Stationary: To record results and to mark the start and finish lines on the ramp.
Results sheet: To record the results
Trays/books: To increase the height of the slope.
I have constructed a method so the same procedure is adopted all through the investigation, this will make it fair as the same set of steps are taken and will ensure a more efficient course of action is taken as I will know what to do and when.
Method
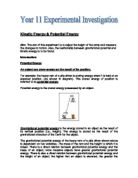
Set-up the equipment as shown in the diagram.
- Mark a line at the top and bottom of the ramp to indicate the start and finish lines. Make the distance from the start of the ramp to the start line slightly bigger than the trolley itself.
- Measure the distance between the start and finish lines and record this.
- Raise the ramp to a height of 10 cm, measure this to confirm. Measure the vertical distance between the finish line and the table.
- Hold the trolley with its front touching the start line.
- Simultaneously let go of the trolley and start the stopwatch being careful not to exert any force on the trolley.
- Stop the stopwatch when the front of the trolley has reached the finish line. Record this time.
- Repeat steps 5 to 7 three times with the same height.
- Find the average of these values by adding the times and dividing by three. Record this Average.
- Increase the height to 20cm, and repeat steps 4 to 9.
- Continue this procedure of increasing the height and obtaining the average time until you have results for 6 different heights finishing at 60cm.
To calculate the speed of the trolley at the bottom of the ramp I will use one of the equations of motion:
S= (u+v) t
2
Rearranging this equation gives
2.S = u+v
t
Where S (m) =distance travelled (distance between start and finish lines)
t (s) =time taken ( average time taken for the trolley to reach the finish line)
As u, the initial speed, will always be zero I will exclude it from the equation.
v (m.s-1)= final speed (The quantity to be calculated)
The final equation is:
2.S = v
t
The formula for gravitational potential energy= m.g.h
Where g=gravity (m.s-1), h=change in height(m) and m=mass(kg).
The formula for kinetic energy = ½.m.v2
Where m=mass(kg) and v=speed (m.s-1).
The equation for a straight-line graph is: y=mx+c. In this equation m is the gradient of the line, and c is the intercept on the y-axis where the line of best it crosses the vertical axis.
To obtain a straight-line graph I will have to re-arrange my formulae in the form y=mx+c. The following is the working out :
m.g.h=½.m.v2
As the mass of the trolley is found on both sides I can divide it out of the equation:
g.h=½.v2
I will now take the g value to the other side by dividing both sides by g.
h=½g.v2
y=mx+c
Comparing this with the straight-line equation shows that the height is the y-value, the speed squared is the x-value and the gradient is ½g. There is no extra term added.
I believe that using the method set out earlier and the equipment mentioned I should be able to produce a set of fairly reliable results. However the only area in which the experiment strategy may let me down is in the human error transmitted through the stopwatches. To counter this I may decide to take more than three readings and average them. I could also repeat the experiment until I achieve results to within a certain range i.e. keep doing the experiment until I receive consistent readings to + 0.2s. My method and the fundamentals of the experiment, I believe are good and simple therefore the justification for the equipment I will use is obvious. If I do the experiment as planned, it should yield fairly precise results with no major inconsistencies.
I have decided to plot my results on a graph which hopefully will be a straight line. The advantage of using a graph to illustrate the values over other methods are the fact that you can literally see all the data points and therefore can easily identify any trends and you can easily spot any anomalies. There are also fewer calculations as a line of best fit can be drawn which averages out the data values. If the line isn’t straight or if it misses the origin you can easily prove there is a fault either in the theory or the experiment/measurements. Instead of having to calculate the k.e. and p.e. of the trolley at each height and plotting a graph of k.e. against p.e., the application of the straight-line equation to the k.e. and p.e. formulae will provide a suitable method to compare these energies.
The formula mentioned earlier to calculate the speed can be used to give a theoretical result prior to conducting the experiment. From looking at the formula you can see that if the height is increased the speed will also increase. Applying this to our experimental situation; the higher the ramp is raised the more g.p.e is obtained, and therefore the higher the speed of the trolley.
If I was to plot the equation h=½g.v2 on a graph with my data values, with h going up the vertical axis, and speed squared along the horizontal axis, I can expect a straight line graph passing through the origin (0,0) as there is nothing added and whose gradient is ½g. This graph would give me a good comparison between the height which is the only variable for the g.p.e. formula and the velocity, the only variable for the k.e. formula.
Conclusion
From the graph I can deduce that as the height increases the speed of the trolley also increases. The graph is a straight-line and the line of best fit passes through the origin.
This is in accordance with my prediction. This is due to the fact that as the height of the ramp is increased the trolley gains more potential energy. When the ramp isn’t inclined i.e. it is horizontal, the speed of the trolley would be 0. Hence the line of best fit passes through the origin. The more gravitational potential energy the trolley gains at the top of the ramp, the more kinetic energy it will have as it falls when the potential energy is converted into kinetic energy. This is because the potential energy the trolley has at the top of the ramp can only be converted into another form, in this case kinetic energy. It can’t be created or destroyed.
I have calculated the gradient of the graph to be 0.06. The predicted gradient ½g, when the value for g is taken at 9.81, comes to 0.051 (to 3 decimal places). My actual gradient is higher than that predicted, this means that there is more potential energy than kinetic energy. This implies that some of the kinetic energy has been lost. This statement is reasonable because in the calculation of the predicted gradient, factors such as friction and sound weren’t considered. In practise, as the trolley rolled down the ramp, friction between the trolley’s wheels and the ramp converted some of the gravitational potential energy into heat. Similarly as the trolley rolled down the ramp, vibrations between the trolley and the ramp caused sound which could be heard. The trolley also acted against other resistive forces such as air resistance. These all combine to reduce the kinetic energy value of the trolley at the bottom of the ramp.
Height affects the speed at which a trolley rolls down a ramp, an increase in height causes an increase in speed. Resistive forces act against the trolley as it rolls down the ramp converting the potential energy into ‘wasted’ forms of energy such as sound and friction.
Evaluation
The procedure I have undertaken to investigate energy changes of a trolley is simple and easy to carry out. The course of action has produced good results without any extreme, unexpected data values. Due to this, on the whole I am pleased with the method .However there are limitations in both the theory put forward and the actual procedure itself. I will now evaluate the procedure I have planned and carried out for my investigation.
Random errors
I used a stopwatch to manually record the time taken for the trolley to reach the end of the ramp. Due to my reaction time and variable human error, this random error has been created. I will estimate the possible error for the timings to be + 0.5s. To improve this weakness in the method, I could use a more reliable means of finding the trolley’s speed such as using a ticker-timer or use a setup with a computer system and light gates. This would greatly reduce this particular error as human error and misjudgement will have been eliminated.
The measurement I made for the length and height of the ramp were made using a metre ruler. This can only be accurate to + 1mm. The stopwatches were accurate to + 0.01s.
As the trolley rolled down the ramp, I couldn’t have been sure the path of the trolley was exactly straight down the ramp. It may not have travelled exactly perpendicular to the edge of the ramp, as I had measured. This would have caused an increase in the distance travelled and hence a decrease in the trolley’s speed. Grooves or a path for the trolley’s wheels would make the distance travelled by the trolley constant throughout.
Systematic error
The stopwatch may have had a systematic error in recording the time. Obviously a stopwatch without this error would be more reliable.
In the theory used to make the prediction, the law of conservation of energy applies only to isolated systems, those in which friction and other resistive forces are absent. As these forces were present, the theory needs to at least recognise their effect if not take them into account. This would produce a revised prediction which takes friction into account. I could then say that the loss of p.e. equals the gain of k.e. and gain of internal energy, or that energy which is lost against friction and other similar forces.
The accuracy of data wasn’t consistent throughout. There were great inconsistencies between the timings and distance measurements for example. If I was to repeat the experiment with the changes I have suggested, all major errors would have been eliminated. This would have definitely reduced the error and increased the reliability of the results. Any conclusions made would be much more valid.
The last three data points; at heights 0.20, 0.25 and 0.30 metres weren’t in accordance with the line of best fit; they differed greatly. As the times of the trolley reaching the bottom of the ramp decreased, the chance of error in reaction time would increase. The times for the highest inclination 0.3m, were around 0.75 seconds, in this short period of time my human error is likely to be amplified with late reaction times.
The first data point seems to be anomalous, however considering the fact that the last data point should have a lower value for speed, a new line of best fit would be closer to it.
Having considered the major errors caused by my timing, the evidence seems unreliable however I did take three values and average them, this does reduce the error. The other measurements were good and reliable. The difference between my value for the gradient and that predicted wasn’t greatly different, a difference of only 0.009. Even with my errors the results weren’t bad and I feel that conclusions can be drawn from them justifiably.