Length of wire: 10cm Resistance: 4Ω
Length of wire: 20cm Resistance: 8Ω
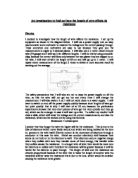
Apparatus:
Power pack – this provides energy for the circuit
3 wires – are used to connect power pack to resistance board
Resistance board – nichrome wire is tied to it and the board is used to work out the length of wire
Nichrome wire (0.2mm) – alloy of nickel and chromium. Acts as a resistor
Ammeter – measures current
Crocodile clips – connect wire to nichrome wire at different length
Preliminary work:
Before the main experiment I did some preliminary work to see if I could improve on our first method. I concluded that we are not going to use a voltage higher than 2V because as the voltage increases the wire gets hotter and at 4V it melts.
Preliminary work results:
Method:
- Set up the power pack and connect power pack wire to crocodile clips.
- Place crocodile clips at 5cm on the nichrome wire.
- Take measurement of current and record in results table.
- Repeat the procedure at 10cm, 15cm, 20cm, etc. until you get to 40cm.
- Repeat the method 3 times.
- Calculate average.
- Calculate resistance using the equation: resistance = voltage ÷ current.
Fair test:
I am going to make this investigation a fair test by repeating the experiment on each length 3 times. I will then work out an average and a resistance (using the average) for each length.
Variables:
In this investigation I varied the length of wire by 5cms for each measurement. The current also changed because of the length of wire. As the length of wire increased the current decreased, this is because as the length of wire increased so the resistance.
Constants:
I kept the voltage at 2V, I used the same nichrome wire all the way through the experiment and the width of the wire remained at 0.2mm.
Safety Points:
I made this test safe by keeping the voltage at 2V. Any voltage higher will heat up the wire and cause it to melt.
Obtaining Evidence:
Initial results (includes errors):
* These results were errors.
Final results:
Analyzing evidence:
Conclusion:
My results show me that the longer the wire the more resistance there is. There was a decrease in current as the length of wire was increased. The rate of decrease in current was proportional to the increase in wire length. As R = V/I and the voltage was constant, the resistance increased with the length of wire change. The graph shows a straight line which is what I expected. There are some results on the increase that stray off the line of best fit. This shows that although my experiment went well it was not perfect. I believe that these errors occurred because the wire was still affected by the results I had taken beforehand. The wire may have been hotter than room temperature when I had taken my next current measurement which affected its resistance.
Percentage of error:
Evaluation:
Even though my investigation went to plan there were a few errors that showed up on my graph. My prediction was correct as I thought before the experiment that as we increase the length of the wire the resistance will increase. My results were accurate because I repeated the experiment 3 times. The errors that occurred I corrected by repeating the length until I got the right result. There are two anomalous results that do not fit on the line of best fit. I think these results occurred because of the temperature of the wire. To improve on the investigation I could change the nichrome wire as we change lengths. Therefore a resistance would be measured on a new piece of wire, which would be at room temperature. This would eliminate temperature affecting the wire. Another way to stop temperature affecting my investigation is to put the nichrome wire in water so heat energy is transferred from the wire to the water.
Another investigation I could do which is related to the experiment is to how temperature affects resistance. I could record the resistance of a wire at different temperatures to see how large the effect is. I could also do a similar investigation to this one by increasing the width of a wire and not its length.