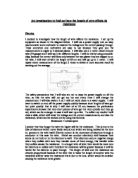
In this experiment I will vary the length of the wire, however the current flow will stay constant, this will be done by using a power supply unit, it will be set to 2 volts and direct flow. The temperature of the circuit and of the wire should be kept constant so after every measurement I will let the wire cool down. I will also keep the diameter constant by using the same piece of wire.
Obtaining evidence
I have collected results and recorded them in 4 tables. The table show 3 trials that I did for each length of wire. I took 24 measurements for currant and 24 for voltage. There were 8 lengths of wire. I took so many results to get accurate averages at the end of the experiment. To work out the resistance I used the formula R = V/I. So therefore the 4th table shows the average measurements of all the lengths and their resistances.
To collect my evidence correctly each time I switched my power supply on and then I waited for the number on the ammeter and on the voltmeter to be stable. However if the readings on them continued jumping, say from 0.65 to 0.72, I would switch the power supply of and then on again to see if it would stabilise, and if not I would take the average of the 2 readings.
Results Tables for the resistance of wire
1st Trial
2nd Trial
3rd Trial
Average Measurements
Analysis
The results from the table and from the graph show how the resistance compares to the length of the wire. From my graph it is clearly seen that there is a very positive correlation, this shows that the longer the wire the higher the resistance, the results obtained are directly proportional, I can see this if I do a couple of simple calculations. I will take the average resistance for 40cm wire and the average of resistance of the wire twice the length i.e. 80cm.
Resistance of wire of 40cm = 1.8 Ohms
Resistance of wire of 80cm = 3.63 Ohms
3.63 / 1.8 = 2.016 ohms
The resistance of 80cm wire is double the resistance of 40cm wire. This proves my prediction where I said that the longer the wire the greater the resistance, and it also proves what I said about the results being directly proportional ie if the wire is twice as long the resistance is twice as great.
The line of best fit on my graph shows that the results have followed the expected pattern. The points are very close to the line of best fit or even touching it. This showed that the results were directly proportional throughout the experiment, as the line does not curve suddenly or curve or bend at all in any way, as the gradient of the line stayed the same throughout.
Evaluation
I thought this experiment went quite well however I did have some problems with measuring the wire, and it getting hot when it was a short piece only. I have burnt myself once because I did not expect the wire to be as hot as it was at length 60cm.
The results and evidence that I have collected were quite accurate, however when a graph was drawn there were some points which did not lie on the line of best fit, but they were very close and followed a stable pattern. It was very strange to notice that the points which had a smaller voltage range showed up as anomalies on my graph however the ones that had the larger range touched the line of best fit. The only result that I thought was out of pattern was the value of resistance for 100cm wire in trial 3. The resistance was smaller than in the length before that 90cm. However this did not affects the average results a lot.
Also another thing that could have affected the resistance was that the wore that I used was made out of a different metal (nickel chrome), when the leads that I used to connect my circuit up were made out of copper, this could have affected the resistance because these metals have different number of loose electrons in them. If I did it again I would have worked out the resistance of copper and then in every measurements I took of the resistance of the nickel chrome wire I would take the resistance of copper at that length, away this would give me a more accurate results. The same problem could have occurred with the crocodile clips that I used
The experiment was easy to set up and control, but the things I would change if I did it against would be:
I would use a different piece of wire every time because when you measure it out and then wind it around the cardboard it is impossible to make it straight again so the next measurement will not be as accurate because of the wire not being straight. It is also very hard to measure and then fix the length with crocodile clips because the clips do not hold on too tightly to the wire. Another way I would do it, I would take a meter ruler and stick the wire on to it and then just use the crocodile clips to increase of decrease the length.
I would use pointer instead of crocodile clips, pointers have a smaller surface area so will not affect the resistance to much, and give more accurate measurements.
If I was to do this experiment again to work on resistance I would firstly investigate the type of wire that I just did further by using a wider range of lengths and start of with 20 cm and go up in 5cm (20, 25, 30, 35…). I would also try different thickness and compare their resistance at the same length to other of different thickness.
I would also try different voltages instead of 2V I would use 4V or 6V. And I would investigate the resistance of wires of different materials.
And I would change the temperature; because from my research I found out that the higher the temperature the higher the resistance of the wire, because when the temperature is high the protons and the electrons start to move faster and more chaotic. I want to find out how the temperature affects different types of wire.