An investigation to find the rate of reaction between hydrogen peroxide and Catalase as the concentration of hydrogen peroxide is changed.
The Decomposition of Hydrogen Peroxide by Catalase
The Decomposition of Hydrogen Peroxide by Catalase
Aim:
An investigation to find the rate of reaction between hydrogen peroxide and Catalase as the concentration of hydrogen peroxide is changed.
Introduction:
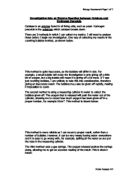
Enzymes are biological catalysts. They therefore increase the rate of reaction by decreasing the activation energy required for that reaction. The catalyst itself is not changed in anyway in the reaction or breakdown. Its main task is to decompose hydrogen peroxide into its elements, oxygen and hydrogen.
Fig 1. Shows lowered activation energy with use of enzyme
Enzymes are globular proteins which are polymers made up of monomers called amino acids and form a three-dimensional shape. These shapes are determined by the tertiary structure of the proteins.
Enzymes have an active site. This is an area on the surface where the substrate molecules combine with the enzyme. The shape of the active site is very important because it complements the shape of the substrate. Enzymes have active sites that are specific to a substrate molecule. This means it is only able to catalyse particular reactions. Catalase is specific to hydrogen peroxide. Therefore I will be using this substrate throughout my investigation.
Hydrogen Peroxide is a viscous liquid that has strong oxidising properties. It is water soluble and is commercially used in disinfectants and germicides.
Hydrogen peroxide often decomposes exothermically into water and oxygen gas spontaneously: 2H2O2 (aq) --> 2H2O (g) + O2 (l) + Energy
Hydrogen peroxide can be decomposed by many organic compounds like dirt, but Catalase has a main function of removing toxic by-products of metabolism.
Factors affecting Rate of Reaction:
There factors affecting the rate of reaction for an enzyme catalysed reaction are explained below. These factors are vital to ensure that all other factors apart from the one being investigated are kept constant and preferably at their optimum, in order to achieve a fair test.
* Substrate Concentration: As the substrate increases so does the rate of reaction because all enzymes molecules would be in use and all active sites will be occupied. Until a point of saturation is reached and then the rete of reaction would remain constant.
* Temperature: Increasing the temperature increases the kinetic energy of the enzyme and substrate molecules. This results in collisions between the two to occur more readily and hence increases the rate of reaction. Until an optimum temperature is reached, above this temperature the enzyme is denatured and the bonds which hold the shape of the enzyme together are broken changing the active site's shape and stopping the substrate molecules from binding to the enzyme.
*
Enzyme Concentration: As enzyme concentration increases, the rate of reaction increases as there are more available active sites. Until a point were the rate of reaction doesn't change significantly and remains constant as there's not enough substrate molecules to bind to their active sites.
* pH: Changes in pH affect the ionization of R group's in proteins and therefore changing the shape of the enzymes active site, slowing the rate of reaction by denaturing the enzyme. However, each enzyme has an optimum pH in which the rate of reaction is fastest.
* Inhibitors: Inhibitors reduce the catalytic action of he enzymes on the substrate by either temporarily binding to their active sites or bind to another part in the enzyme molecule causing the active site to denature, so the substrate can no longer bind to it. This slows down the rate of reaction and in some cases stops the reaction from taking place.
Planning:
Hypothesis:
The rate at which Catalase catalyses the decomposition of hydrogen peroxide is expected to increase with increasing concentrations of hydrogen until a certain point, where the rate of reaction will stay ...
This is a preview of the whole essay
* Inhibitors: Inhibitors reduce the catalytic action of he enzymes on the substrate by either temporarily binding to their active sites or bind to another part in the enzyme molecule causing the active site to denature, so the substrate can no longer bind to it. This slows down the rate of reaction and in some cases stops the reaction from taking place.
Planning:
Hypothesis:
The rate at which Catalase catalyses the decomposition of hydrogen peroxide is expected to increase with increasing concentrations of hydrogen until a certain point, where the rate of reaction will stay constant despite increasing substrate concentrations.
The rate of reaction will increase as hydrogen peroxide concentration increases because the rate of enzyme-substrate complexes forming increases. Until a given time, whereby the number of active sites on the Catalase molecule is less than the number of hydrogen peroxide molecules. This conveys that the substrate molecules are broken down in a certain time, as so the rate of reaction is faster. This will be shown during the experiment by a larger volume of oxygen released in a given time with higher hydrogen peroxide concentrations. It is expected that a point will be reached where the rate of reaction will remain constant because the number of hydrogen peroxide molecules will be greater than the number of active sites on the Catalase molecules. Beyond this point no matter how much more hydrogen peroxide s added the Catalase can't increase the rate of the reaction. Therefore maximum velocity is reached as the rate of reaction is constant.
The methods that will be used to determine the rate of reaction is:
Rate of Reaction = Volume of Oxygen / Time of Reaction
Preliminary Testing:
The preliminary was carried out to decide on the number of measurements to be taken, in order to construct reliable, useful and accurate results. It was of extreme importance to do this in order to determine the different concentrations of hydrogen peroxide and Catalase. As well as to determine the time for each sample to be tested, to examine the apparatus, to observe and put right any errors within the method and to determine how all important variables are to be controlled to produce reliable results. In addition to that, preliminary work was vital in assessing the terms of safety within the procedure by identifying any potential risks in substances, equipment, procedure and the disposal of materials safely.
Hydrogen Peroxide, as explained above, decomposes to form oxygen and water. The apparatus was set up so that it would measure the volume of oxygen released in a given time so that the rate of reaction at that time, for each tissue, at each concentration could be calculated. This method was found to be more accurate and reliable to that of counting the number of bubbles released at a given time. This is because counting the number of bubbles produced accurately in a Catalase experiment would be impossible as a lot of oxygen is released at the same time. The different concentrations of hydrogen peroxide were made up using a 10vol concentration to begin with and diluting it with distilled water accordingly (as shown in step 7 of the 'method'). These concentrations were created to a suitable range in order to convey a difference in the affect on Catalase, if any, between them. Six different concentrations were chosen rather than a smaller amount to ensure this. However, if a greater number of concentrations were chosen timing difficulties would be faced. Each time a concentration of hydrogen peroxide was placed in the conical flask the Catalase solution was poured over it. A rubber bung was immediately placed over the conical flask and the stop clock started. Each reaction was timed for five minutes and the volume of oxygen produced recorded at sixty second intervals. This procedure was repeated at each hydrogen peroxide concentrations.
The concentrations that will be tested are:
* 1.0M (10ml Hydrogen peroxide)
* 0.8M (8ml Hydrogen peroxide/2ml Distilled water)
* 0.6M (6ml Hydrogen peroxide/4ml Distilled water)
* 0.4M (4ml Hydrogen peroxide/6ml Distilled water)
* 0.2M (2ml Hydrogen peroxide/8ml Distilled water)
* 0.0M (0ml Hydrogen peroxide/10ml Distilled water)
Equipment list:
Hydrogen Peroxide (10 Vol)
Catalase (100%)
Delivery Tube
Burette
Clamp and stand
Distilled Water
Timer
Water Bath
Beakers
Thermometer
25ml Conical Flask
Pipette
Goggles
Lab Coat
Gloves
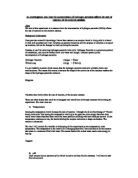
Diagram:
Method:
) Switch on the bath at 30°C (confirm Temperature with Mercury thermometer)
2) Set up the Equipment as show in the diagram above.
3) Create Catalase solution by adding 0.32ml of Catalase to 1.68ml of distilled water in a 10ml beaker. (Use 1ml pipettes to measure these values. Note: Use and label two different pipettes for each solution).
4) Create Hydrogen Peroxide solution as shown above in concentration section. (Note: use 10ml pipettes, separate pipettes for each solution). Pour the hydrogen peroxide solution into the 25ml conical flask.
5) Pour the Catalase into the flask and place the stopper on the top, and start the timer.
6) Record Results for every 60s
Results:
H2O2 (ml)
H2O (ml)
Catalase (ml)
Vol. of Oxygen (ml)
Time (s)
0
0
2
30
0
8
2
2
45
0
6
4
2
39
0
4
6
2
22
0
2
8
2
7
0
0
0
2
0
0
The problem encountered in this preliminary test was the high concentration on Catalase. It should now be changed to a lower concentration for a re-test. Unfortunately the reactions were so fast that a lot of the oxygen was released before the bung could be placed on the conical flask.
In this re-test the
7) Create Catalase solution by adding 0.2ml of Catalase to 2.5ml of distilled water in a 10ml beaker. (Use 1ml pipettes to measure these values. Note: Use and label two different pipettes for each solution).
H2O2 Conc. (mol)
Volume of Oxygen Produced (ml) in the given time
60s
20s
80s
240s
300s
50
55
58
60
63
0.8
42
46
47
51
53
0.6
34
35
37
42
43
0.4
21
23
25
25
27
0.2
7
8
8
9
0
0
0
0
0
0
0
As can be seen by the results, the volume of oxygen released, by the action of the Catalase on the hydrogen peroxide decreased with lower substrate concentrations, indicating a decrease in the rate of reaction, as expected. This is because at low hydrogen peroxide concentrations there are fewer substrate molecules to bind with the larger amount of Catalase molecules to form substrate-enzyme complexes, and therefore lowers the rate of reaction.
Risk Assessment:
Risk: H2O2 (Hydrogen Peroxide)
Problem: It is an extremely powerful oxidising agent that's toxic and harmful to clothes and any body parts e.g. skin, eyes.
Precaution: Goggles, lab coats and gloves will be worn to minimise and injuries that may occur throughout the practical.
The H2O2 will be stored in a labelled laboratory container with a lid on at all times when not in use. Labels are also put on all beakers.
Implementation:
The experiment was carried out in order to test the hypothesis stated before. The procedure used on the day of the experiment is explained below:
Hydrogen peroxide and distilled water was poured into each of the beakers, which were labelled appropriately with their contents. The amounts needed for each concentration were measured using separate pipette for each substance. With the distilled water, slightly more than 10ml was drawn up, and then the excess pushed out of the pipette into the sink, to the required volume. Instead of making up the two sets of the six hydrogen peroxide concentrations from the beginning of the experiment as planned, one set was made up at a time. This was to avoid leaving the hydrogen peroxide exposed to air for long periods as it could decompose and therefore would create an inaccuracy in the results. The test tubes were labelled appropriately with the hydrogen peroxide concentration in vols. This was to prevent mistakes from happening as well as to ensure the correct concentration was used each time during the experiment.
The apparatus was setup as shown in the planned method. This was done by filling a beaker with tap water; it was filled with enough water so that when the full burette was able to be inverted into it with the water above the mouth of the burette. The burette was carefully clamped so that its markings pointed to the front and could be seen clearly. The delivery tube was inserted into the mouth of the burette and connected to the conical flask. The hydrogen peroxide solution is poured into the conical flask and then the Catalase solution is added. The bung is immediately placed over the conical flask and the stop clock started. The reaction was timed for five minutes and the volume of oxygen produced recorded every sixty seconds. After the first experiment, the contents of conical flask were carefully tipped into the waste container. The conical flask was rinsed and the apparatus set up again.
Results:
After the results were recorded in the table, averages of the results were taken. The average for each hydrogen peroxide concentration, for the volumes produced within the sixty-second intervals was calculated by adding the two results up and then dividing their answer by two. This was then recorded in the third column for each concentration in the table.
H2O2 Conc. (ml)
Volume of oxygen (ml)
0s
60s
20s
80s
240s
300s
0
50
56.2
59.4
61
61.5
0.8
0
51.5
65
67.5
68
69
0.6
0
31
45
51.3
54.3
56.8
0.4
0
26.3
36.5
41
43.7
44.8
0.2
0
4.4
22
24.5
25.4
26
0
0
0
0
0
0
0
Observations:
Vigorous bubbles were observed inside the conical flask at the start of the reactions, especially with the higher hydrogen peroxide concentrations. The rate of bubbles entering the burette decreased as the reaction continued. As the concentration of hydrogen peroxide was decreased the produced bubbles decreased.
One of the problems that were met in the experiment can be seen in the results for the 1M test. The results for that concentration should have in theory decomposed the hydrogen peroxide at a faster rate than 0.8M, but the problem was that it became difficult to replace the bung without letting any oxygen be released. Unlike in the other tests were the rate of reactions is slower allowing the return of the bung without releasing enough oxygen that would impact the results.
Analysis:
The results in the table above allow us to plot a graph to show the initial rate of reaction, and how it changed according to the concentration of the hydrogen peroxide.
The graph above clearly shows that the rate of reaction decreases almost proportionally to the decrease in hydrogen peroxide concentration. This graph show the rate of reaction by the equation:- Rate = Oxygen produced / Time.
This graph more clearly shows the anomalous result in the concentration 1M, since it should have had a higher production of oxygen volume.
Evaluation:
Criticisms of the method:
* The main problem with the method stated earlier is that the bung is not replaced earlier enough when the concentration of the hydrogen peroxide is too high. The problem is that too much oxygen is leaked before that bung is put back to seal the conical flask.
* Hydrogen peroxide is measured in Vol's not moles. This could cause the results to be inaccurate as to the usual behaviours of a 1 mole concentration.
* When using a pipette some times an air bubble may get in the way, and it isn't always possible to remove them, like when measuring hydrogen peroxide where there are health risk precautions that need to be taken.
* The timer may have been started a little late due to human reaction time, and also in the cases where the concentration of hydrogen peroxide is high there wasn't always enough time to start the timer and put the bung on the top of the conical flask at the same time, this caused some timing errors.
Improvements:
* Clean all equipment that needs to be used thoroughly before use.
* More repeats need to be taken to obtain more accurate results.
* Investigate with more variables like, the concentration of Catalase or temperature.
Percentage error:
Percentage error = (error / measurement taken) x 100
Maximum error calculated
* Thermometer - error = ± 0.05°C
(0.05 /30) x 100 = 0.1667%
* Burette - error = ± 0.1ml
(0.1/14.4) x 100 = 0.694%
* Pipette - error = ± 0.1cm3
(0.1/0.2) x 100 = 5%
* Timer - error = ± 0.005s
(0.005/60) x 100 = 0.0083%
Total = 5.869% error
Bibliography:
* Chemical Ideas, Salters Advanced Chemistry
* A-level Chemistry, Ramsden
* http://www.chemsoc.org/networks/learnnet/cfb/enzymes.htm
* Biology, Collins Educational
* Chemistry in Context, Nelson