The ECG can also be used to assess the elasticity of the vessels that carry blood away from the heart. The Pulse wave velocity is calculated by dividing the distance between the heart and the wrist, by the time difference between ventricular contraction and generation of pulse pressure in the wrist. (Seeley 2000)
When a person undertakes strenuous exercise the muscles require more energy, in the form of ATP. Therefore, aerobic respiration increases and the heart and lungs must deliver more oxygen to the mitochondria of muscles through the blood. The heart can increase the quantity of blood delivered to the tissues by increasing the volume of blood per beat (stroke volume), increasing the heart rate, or both.
The total cardiac output needed can be worked out by using a formula.
Total cardiac output = stroke volume x heart rate
When people train and exercise they gradually become fitter, which therefore the volume of the heart increases, and the heart rate can slow down and remain slower.
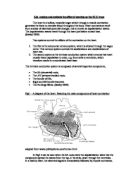
5.3b Describe the effect of endurance and power/strength exercise on blood pressure.
Blood pressure is the pressure of the blood flowing through your blood vessels against the vessel walls. The blood flow is how much blood is pumped by your heart. If the pressure is high, your heart must work much harder to maintain adequate blood flow to your body. (McArdle et al 2001)
Fig 4 – Blood pressure through blood vessels
adopted from (Bennett 1993)
A heart can beat more than 100,000 times a day. Each time it beats, a rush of blood is pumped from your heart into your arteries. This increases the pressure in your arteries. In between heartbeats the pressure in your arteries decreases.
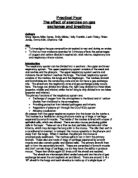
Fig 5 – The heart’s alterations during contractions
adopted from (Bennett 1993)
Systolic and Diastolic Blood Pressure
Blood pressure is always stated as two numbers, e.g., 120/80. The first, higher number (systolic) is the pressure of the blood against the artery walls when the heart contracts (e.g., 120). The second, lower number (diastolic) is the pressure against the artery walls when the heart relaxes between beats (e.g., 80). The average blood pressure is 120/80.
Systolic Blood Pressure
This is the high pressure phase of blood circulation, experienced every time the heart muscle (left ventricle) contracts and pumps blood through the arteries.
Diastolic Blood Pressure
This is the low pressure phase of blood circulation, experienced throughout the heart's rest period between contractions.
At normal resting conditions, the blood pressure against the artery walls is about 120 mm Hg. When the heart muscle contracts the diastolic reading is about 80 mm Hg.
When the heart muscle relaxes between beats, if the systolic reading is above 140 mm Hg and diastolic reading is above 90 mm Hg this is considered hypertensive. Hypertensive blood pressure indicates that the pressure of the blood against the artery walls is higher than desirable and maybe a health risk if it remains at these levels.
During exercise the demand for oxygen by muscle tissue increases. To meet this demand, blood pressure increases, causing an increase in blood flow to the tissues. (McArdle et al 2001)
Strength and aerobic exercises effects on blood pressure
Aerobic training, resistance training and circuit weight training conducted at 70-75% of maximal capacity are associated with reductions of resting systolic pressure (e.g. decrease of 11mmHg) and diastolic pressure (e.g. decrease of 8 mmHg) This effect is usually only found in people who suffer from hypertension (140-155 mmHg systolic and greater than 95 mmHg diastolic), although smaller reductions are also observed in other people. (Brooks et al 1992)
The exercise adaptations that result in the blood pressure lowering effect have been extensively researched, but as yet unsolved. However, following training it is likely that resting heart rate and cardiac output are reduced and therefore blood pressure is lower.
Strength Exercises
Exercise physiologists usually advise people to perform aerobic exercise at approximately 75 percent of their maximum heart rate. Training at this intensity often results in a peak systolic blood pressure increase of about 35 percent. However, in some studies, peak systolic blood pressure increased approximately 35 percent during 10 repetition maximum efforts in arm strength exercises, and 50 percent increases were found during leg strength exercises.
Therefore the systolic blood pressure response to standard strength training is similar to that of endurance exercises, and well within acceptable limits for physical activity. (Brooks et al 2001)
Blood pressure studies
Some studies on the heart rate found that strength training appears to produce cardiovascular responses similar to aerobic exercise.
The strength exercises examined were machine chest presses and machine bicep curls for the upper body muscles, and machine leg extensions and machine leg curls for the lower body muscles. The training intensities assessed were at 70 percent and 85 percent of maximum resistance. All of the research subjects wore new electronic heart rate monitors while they performed as many repetitions as possible with both 70 percent and 85 percent of their 1 RM in the four strength exercises. And, the subjects recovered as long as necessary to return to their resting heart rates between successive trials. (Wyatt 2002)
Study results
The results showed that exercising to the point of muscle fatigue with 70 percent and 85 percent of maximum resistance produced almost identical increases in heart rate. On average, the 70 percent of 1 RM weight load increased subjects' heart rates to 123 beats per minute, and the 85 percent of 1 RM weight load increased their heart rates to 122 beats per minute.
Both of these peak strength-training heart rates were lower than what is typically recommended for aerobic exercise at approximately 75% of max predicted heart rate. This indicates that properly performed strength training and aerobic exercises can produce similar heart rate responses.
The increase in heart rate above resting level was 53 beats per minute when exercising with 70 percent of 1 RM weight load, and 50 beats per minute when training with 85 percent of 1 RM weight load. (Wyatt 2002)
Performing strength training produces cardiovascular responses similar to aerobic exercise.
In this study, the peak systolic blood pressure response was approximately 35% above resting level during aerobic exercise that was performed at 75% max.
The peak systolic blood pressure response during upper-body and lower-body strength exercises with the 10-repetition maximum weight load was about 50% above resting level. This data is showed in figures 6 and 7. (Wyatt 2002)
Fig6 – Effects of aerobic exercise on blood pressure
adopted from (Wyatt 2002)
Fig7 – Strength exercise effects on blood pressure
adopted from (Wyatt 2002)
Figures 6 and 7 shows that, during aerobic exercise the subjects systolic blood pressure raised from 114mmHg to 154mmHg which is a total increase of 35%, whereas when they performed the strength exercise their blood pressure raised from 127mmHg to 190mmHg which is a total increase of 50% . This shows that maybe strength training is a better source of exercise for raising systolic blood pressure.
Due to the slower heart rate increase on strength training, it is recommended for persons with cardiovascular concerns. By wearing a heart rate monitor, people may safely perform strength exercises within prescribed heart rate ranges, possibly from doctors. Heart rate-monitored strength training is just as important as heart rate-monitored aerobic activity for; cardiac rehabilitation patients, post-surgery participants, elderly exercisers and other high-risk individuals.
Aerobic Exercise
Blood pressure is controlled by a mechanism known as the baroreflex. This is located in the an artery of the neck, the carotid artery and in the aorta. Here there are a series of pressure sensitive cells known as baroreceptors. These baroreceptors detect the level of blood pressure and relay information to the cardiovascular control centre in the brain. (Brooks et al1992)
If there is an error between the measured and required pressure, certain responses occur to correct the difference.
For example,
At rest whilst sitting, average blood pressure is 120 mmHg systolic and 80 mmHg diastolic. If the individual then stands, blood pressure drops due to the influence of gravity. This reduction in pressure is detected by the baroreceptors and heart rate and cardiac output are elevated such that blood pressure can be returned to its normally value. During exercise the baroreflex remains active in controlling the level of blood pressure.
During exercise there are certain changes in the cardiovascular system. The greatest change occurs in blood flow to exercising muscle which, when intense exercise occurs conditions can increase up to 35 times. Such a large increase in blood flow has severe consequences for blood pressure regulation, as the opening of this large circulation can result in a sudden and large drop in pressure. (Brooks et al 1992)
At the start of exercise the level of required pressure is set to a higher value in the control centre in the brain. At this time the baroreceptors detect and relay the measured pressure to the brain, but because of the large increase in muscle blood flow this measured pressure is well below that new required level. In order to correct the difference, nerve impulses are sent to the heart to increase both heart rate, stroke volume and cardiac output and therefore, allow blood pressure to be maintained at the necessary level. (Brooks et al 1992)
After exercise blood pressure drops, this can be because of three main factors.
- As soon as the muscles stop contracting there is no longer a pump to force the blood back to the heart. As there is limited blood in the heart, cardiac output will decline and blood pressure will drop.
2. For some time following exercise, there are still high concentrations of lactic acid and other substances that cause the blood vessels in the muscle to remain expanded. This allows the blood flow to these areas to remain very high, resulting in a fall in blood volume of the heart and again causing a lowering of pressure.
3. Following exercise, body temperature is elevated. To lose this internal heat load, blood vessels in the skin open which allows increased blood flow to the skin and the off-loading of heat to the environment. Once again this can reduce blood volume in the heart and result in hypotension.
5.3c Describe the rate of blood flow and the distribution of blood at rest and during exercise
The entire circulatory system functions to maintain adequate blood flow to all tissues. “Approximately 84% of the total blood volume is contained in the systemic circulatory system” (Seeley 2000).
Most of the blood volume is in the veins. These veins have the greatest compliance, which means the walls can stretch at times of increase blood volume or pressure. Smaller volumes of blood are in the arteries and capillaries.
Fig8 - Distribution of blood in blood vessels
Adopted from (Seeley 2000)
Fig8 shows how most of the blood lies in the veins during normal resting periods. The veins posses 49% more blood than the arteries, however the arteries have a thick muscular wall lining the inside so less blood can pass through them at any one time.
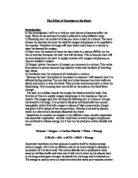
Fig 9 – Blood Distribution around the body during rest
adopted from (Brooks et al 1992)
Fig9 – Shows the distribution of the blood in various body tissues during normal resting circumstances. The digestive system and the kidneys possess the most blood, whereas the heart has the least with only 3% of the total bodies blood supply at any one time. The diagram shows that the skeletal muscle posses 15%, however this figure will rise dramatically during exercise.
Fig 10 - Blood volume comparison, between during rest and exercise
Adopted from (Kimball 2002)
Fig 10 shows the distribution of blood in the human body at rest and during strenuous exercise. There is a huge increase in blood supply to the working organs during exercise, especially in the skeletal muscles and the heart. The increased blood supply to the skin helps disperses the heat that is produced by the muscles. However, the blood supply to the brain remains constant. The total blood flow during exercise increases because of a more rapid heartbeat and also a greater volume of blood pumped at each beat.
Exercise uses up a lot of energy, which the cells get from oxidising glucose. Both glucose and oxygen have to be delivered by the blood during exercise. This means that the heart has to work harder to pump more blood through the body. This means it has to beat faster in order to achieve a higher throughput. This equation shows how to work out the average blood flow.
Blood flow = Heart rate X Stroke volume
The average heart rate for a human at rest is about 70 beats/min. During exercise, a persons heart rate can increase dramatically. This will therefore result in a increase in blood flow. A persons maximum heart rate can be worked out by, this equation.
Max heart rate = 220 – Persons Age
The circulatory system automatically immediately responds to an increased need for blood by adjusting the width of the blood vessels, primarily the arterioles and venules.
The circulatory system can perform this by constricting blood flow the organs that need less oxygen during exercise and widening the arterioles to the organs which need more.
For example,
The brain may use up to 30% of total blood flow whilst your resting, but when you're exercising less than 10% of total blood flow goes through it. Also, muscles use less than 10% of blood flow when at rest, but can take up to 50% of it when they're performing exercise. This regulation is an essential mechanism for delivering oxygen and glucose to the tissues that need it most.
When you exercise, the blood vessels in your muscles expand and the blood flow is greater, e.g. more water can flow through a fire hose than through a garden hose.
When the body needs to expand the blood vessels, ATP gets used up in the working muscles, and the muscle produces many metabolic substances, e.g. adenosine, hydrogen ions and carbon dioxide. These components leave the muscle cells and cause the capillaries within the muscle to expand. Therefore the increased blood flow delivers more oxygenated blood to the working muscle.
When you begin to exercise, sometimes blood has to be taken from other organs. Blood that would have gone to the stomach or the kidneys during rest, goes to the muscles instead. This is because as your muscles begin to work, the nervous system stimulates the nerves to the heart and blood vessels. This nervous stimulation causes those blood vessels to contract. This contraction then reduces the blood flow to tissues. This helps increase the delivery of oxygenated blood to working muscle so you can exercise for longer.
During exercise the heart has to get more blood out to the body's hard-working muscles. The heart's blood flow increases by about four or five times from that of its resting state. Your body does this by increasing the rate of your heartbeat and the amount of blood that comes through the heart and goes out to the rest of the body.
As you begin to exercise, the nerves stimulate the heart to beat with more force and faster; the heart rate can increase about three times. Also, the nerves send stimulations to the veins causing them to constrict. This, along with more blood being returned from the working muscles, increases the amount of blood returned to the heart. The increased return helps to increase the stroke volume by about 30 to 40%.
Shunting
Blood that is completely oxygenated is called shunted blood. There are two sources of shunted blood in the lungs. An anatomic shunt results from deoxygenated blood from the bronchi and bronchioles mixing with blood in the pulmonary veins. The other source of shunted blood is blood that passes through pulmonary capillaries but does not become fully oxygenated. The physiologic shunt is the deoxygenated blood from the pulmonary capillaries plus the deoxygenated blood from the anatomic shunt. (Seeley 2000)
5.3d Construct oxygen dissociation curves for haemoglobin and myoglobin incorporating the effects of increased temperature and acidity (Bohr effect).
In the body most oxygen is carried from the lungs to the cells in the red blood cells, the erythrocytes. Inside the erythrocytes are haemoglobin molecules. The protein part of the haemoglobin molecule is known as globulin. This is composed of 4 polypeptide chains. Each polypeptide chain also has an iron containing heme group to which oxygen binds forming oxyhemoglobin. (Seeley 2002)
Hb + O2 -------> Hb - O2
Oxygen attaches to the heme groups so a haemoglobin molecule carries 4 units of oxygen when it is 100% saturated. The ability of haemoglobin to bind with oxygen is a function of the partial pressure of oxygen, p O2.
The oxygen dissociation curve describes the percentage of haemoglobin saturated with oxygen at any given partial pressure of oxygen (Po2) Some curves are shown by values such as the P50 value. This is a value which tells the pressure at which the erythrocytes are 50% saturated with oxygen. (Seeley 2002)
The purpose of an oxygen dissociation curve is to show the equilibrium of oxyhaemoglobin and non-bonded haemoglobin at various partial pressures. At high partial pressures of oxygen, which can usually be found in the lungs, haemoglobin binds to oxygen to form oxyhaemoglobin. When the blood is fully saturated all the erythrocytes are in the form of oxyhemoglobin. As the erythrocytes travel to the bodies tissues, which have little oxygen, the partial pressure of oxygen will decrease.
Also the oxyhemoglobin can release the oxygen to form haemoglobin. The oxygen dissociation curve forms an ‘S’ shape which is a result of the supportive binding of oxygen to the four polypeptide chains. The supportive binding is the characteristic of a haemoglobin to have a greater ability to bind to oxygen. Haemoglobin is most attracted to oxygen when three of the four polypeptide chains are bonded to oxygen. (Seeley 2002)
There is several certain factors that influence the binding of oxygen and haemoglobin.
- Increasing the temperature denatures the bond between oxygen and haemoglobin, which increases the amount of oxygen and haemoglobin and decreases the concentration of oxyhemoglobin. This results in the oxygen dissociation curve to move to the right.
- A decrease in pH, which means an increase in acidity, by adding carbon dioxide or other acids causes a Bohr Shift. A Bohr shift occurs by causing more oxygen to be given up as oxygen pressure increase.. This also results in the oxygen dissociation curve to move to the right.
- Diphosphoglycerated (DPG) is the primary organic phosphate. DPG binds to haemoglobin which rearranges the haemoglobin into the T-state, therefore decreasing the attachment of oxygen for hemoglobin (T and R State). This also results in the curve to move to the right.
Fig 11 - The oxygen dissociation curve under normal resting conditions
adopted from (Rowell and Shepherd 1997)
In Fig11 the oxygen dissociation curve is shown on a graph. In this graph several important factors can be obtained.
The pO2 in the lungs is 100mmHb. At this partial pressure haemoglobin is 100% saturated. This is because blood entering the lungs picks up and binds to oxygen immediately.
The pO2 in normal tissues is 40mmHb. At this partial pressure haemoglobin is 75% saturated. Haemoglobin gives up 25% of its oxygen when it reaches the tissues with their lower partial pressure of oxygen. The tissues need the oxygen to function efficiently. Partial pressure is lower in the tissues, because they have used the oxygen to perform the Kreb cycle. They then need to replenish the oxygen. When fully oxygenated blood arrives at the tissue, the lower partial pressure of oxygen causes haemoglobin to give up oxygen to the tissues. (McArdle et al 2001)
Only 25% of the oxygen available on the haemoglobin molecule is given to the tissues. This means the haemoglobin is still carrying 75% of the oxygen it picked up in the lungs. The remaining extra oxygen is known as an oxygen reserve. When exercise occurs the tissues suddenly develop a need for more oxygen and the pO2 of the tissues drops below 40mmHg, oxygen starts to separate off the haemoglobin molecules at a very rapid rate.
Fig11 shows a very steep incline in the curve between 0 and 40 mm of Hg. This is the extra oxygen, which is used as our emergency supply for times of greater oxygen usage in the tissues, e.g. exercise.
The Bohr effect
The Bohr Effect plays a main role in oxygen-hemoglobin dissociation curve. Carbon Dioxide diffuses into alveoli when the blood passes through the lungs, this results in a decrease in the blood pCO2 and also decreases hydrogen ion concentration. This moves the dissociation curve to the left. The amount of oxygen that binds with haemoglobin at any given alveolar PO2 increases and provides for greater O2 transport to the tissues. When the blood reaches tissue capillaries, CO2 enters the blood and moves the curve to the right, therefore displacing oxygen from haemoglobin and oxygen delivery occurs at a higher PO2. (Seeley 2002)