- Sodium metal- on observation we see an effervescence and gas
Conclusion – All acids react with reactive metals and this produces a salt and hydrogen gas.
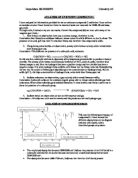
ANALYSIS OF INFRARED SPECTRUM
This was the infrared spectroscopy of compound C. I have located the different absorptions on the diagram and now will explain, which functional groups are present.
-
The very broad absorption between 2500-3500 cm-1 indicate the presence of an O-H bond in a carboxylic acid and not an alcohol because alcohols have a less broad absorption between 3230-3550 cm-1.
-
The absorption between 1680-1750 cm-1, indicates that there is a C=O bond present
-
Lastly, there is an absorption between 1000-1300 cm-1, which shows that there is a C-O bond present, this is of medium intensity.
This information tells me that compound C is a carboxylic acid as it contains all these bonds;
NMR SPECTRUM
Nuclear magnetic resonance spectroscopy provides information about the carbon atom of the skeleton and the hydrogen atoms bonded to the carbon.
Compound C, has two distinct sets of peaks therefore has two sets of chemically different protons present. To identify the type of protons, I located the S value (chemical shift) and referred to the table.
-
Peak 1 has 1hydrogen and the chemical shift is between 11.0-11.7, therefore the type of proton present is OH attached to:
This is supported by the fact that the hydrogen on the –COOH group is highly electron deficient because of the proximity of the two electronegative oxygens. The NMR spectra illustrates this by the large chemical shift of the –COOH protons at values for S greater then 10.
There is no splitting of this absorbance peak into a pattern of sub-peaks. It is a singlet because it hydrogen bonds to another molecule, its in its own environment. It has no adjacent carbon atom, it is next to the O, therefore 0+1 = 1(singlet)
-
Peak 2 has three hydrogens attached and the S value is 2.0, therefore the type of proton present is CH3 at the end of the molecule:
O
CH3 – C
R
There is no splitting of this absorbance peak into a pattern of sub-peaks and this has helped in identifying the structure of the unknown compound. This shows that there is no adjacent chemically different protons to the CH3 therefore it is a singlet as well.
HOW DOES SPLITTING OCCUR
A high-resolution NMR spectrum shows splitting of peaks. Spin-spin coupling patterns-
- Arise from interaction between protons on adjacent carbon atoms, which have different chemical shifts
- Indicate the number of adjacent protons.
- Spin-spin coupling pattern show as a multiplet-a doublet, triplet, quartet.
We can interpret the spin-spin coupling pattern using the n+1 rule. For n adjacent protons, the number of peaks in a multiplet is = n+1
All this information shows that this compound has a methyl and a carboxylic acid:
I predict that compound C is = CH3 COOH- ethanoic acid. Relative molecular mass of: 60
MASS SPECTRUM
Now I will analyse the mass spectrum for this compound, to see whether this supports my prediction.
The mass spectrum of compound C shows that the molecular ion peak is at 60; therefore RAM of this compound is 60, hence that of Ethanoic acid. The m/e values of the main peaks are; 60, 45,43 (bases peak), and 15. The table below shows the identity of the main peaks:
Conclusion
From this you can clearly see that the unknown compound was Ethanoic acid.
The IR spectrum indicated that the bonds in this compound were: C-O, OH and C=O bonding. The NMR helped me identify the types of protons and functional groups present: there was a OH proton attached to a carboxylic acid and there was also a CH3 proton present. the spin spin coupling pattern showed that there was no adjacent proton to the CH3. When referring back to the wet test, it also supports my conclusion as it is an acid with a pH below 7 and this turns blue litmus red. The reaction with the carbonate was the same test I preformed in my plan to identify the carboxylic acid and I also recorded the same observations.
To perform my analysis, I will be analysing the information on the NMR, mass spectrum and the IR spectrum. Here I have briefly researched on the different spectrum and how they work.
Infrared spectroscopy
Infrared spectroscopy is a useful technique in the determination of a compounds structure. Molecules are able to convert energy from infrared radiation into energy to vibrate their bonds. Chemical bonds in different environments will absorb varying intensities and at varying frequencies in the infrared region of the spectrum. An infrared spectrum is obtained by passing a range of infrared frequencies through a compound producing peaks. These peaks can be matched to those of known bonds to identify help identify structural in an unknown compound.
Nuclear magnetic resonance spectroscopy
Nuclear magnetic resonance spectroscopy provides information about the carbon atom of the skeleton and the hydrogen atoms bonded to the carbon.
In brief:-
The nucleus of an atom of Hydrogen has a magnetic spin. When placed in a strong electromagnetic field:
- The nucleus can absorb energy from the radio frequency region of the spectrum, different radio frequencies are absorbed depending on the environment of the proton
- Nuclear magnetic resonance occurs as protons resonate between their spin energy states.
An NMR spectrum shows absorption peaks corresponding to the radio frequency absorbed and this can be matched to those of known types of protons, allowing structural features of an unknown compound to be identified.
Chemical shift
Electrons around the nucleus shield the nucleus from the applied field. This is because the magnetic field at the nucleus of a particular proton is different from the applied magnetic field and the chemical shift, is a measure of the magnetic field experienced by protons resulting from nuclear shielding. Chemical shifts indicate the types of protons and functional groups present, ( it is measured relative to a standard: TMS, Si(CH3) 4
Mass spectrometry
Organic molecules can be analysed using the mass spectrometry.
In mass spectrometry, a substance is bombarded with an electron beam having sufficient energy to fragment the molecule. The positive fragments produced (cations), are accelerated in a vacuum through a magnetic field and are sorted on the basis of mass-to-charge ratio. Since the bulk of the ions produced in the mass spectrometer carry a unit positive charge, the value m/e is equivalent to the molecular weight of the fragment. The analysis of mass spectroscopy information involves the re-assembling of fragments, working backwards to generate the original molecule.
The output of the mass spectrometer shows a plot of relative intensity vs. the mass-to-charge ratio (m/e). The most intense peak in the spectrum is termed the base peak and all others are reported relative to its intensity.
The process of fragmentation follows simple and predictable chemical pathways and the ions, which are formed, will reflect the most stable cations, which that molecule can form. The highest molecular weight peak observed in a spectrum is the parent molecule, minus an electron, molecular ion (M+), which indicates the RAM of the compound.