GCSE Biology - Osmosis Coursework
Potato and Osmosis Investigation
Skill Area P: Planning
Aim: To investigate the effect of varying concentration of a certain sugar solution on the amount of osmotic activity between the solution and a potato chip of a given size.
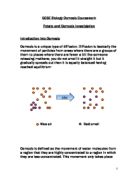
Hypothesis: Osmosis is defined as the net movement of water or any other solution¡|s molecules from a region in which they are highly concentrated to a region in which they are less concentrated. This movement must take place across a partially permeable membrane such as a cell wall, which lets smaller molecules such as water through but does not allow bigger molecules to pass through. The molecules will continue to diffuse until the area in which the molecules are found reaches a state of equilibrium, meaning that the molecules are randomly distributed throughout an object, with no area having a higher or lower concentration than any other.
For this particular investigation I think that the lower the concentration of the sugar solution in the test tube the larger the mass of the potato will be. This is because the water molecules pass from a high concentration, i.e. In the water itself, to a low concentration, i.e. In the potato chip. Therefore, the chips in higher water concentrations will have a larger mass than in higher sugar concentrations.
The graph above shows a simple curve obtained when the concentration of the solution is plotted against the percentage change in mass.
"Y At point A the graph tells the viewer that no osmosis has occurred, suggesting that the concentration of water inside the cell is equal to the solution outside.
"Y At point B (high water concentration), there is no indication that the cell is increasing further in size. This is because the cell is fully turgid and no more water can enter.
"Y At point C (low water concentrations), there is no indication that the cell is decreasing further in size. This is because the cell is fully plasmolysed and no more water can leave the cell.
Further information on potato plant cells:
Plant cells always have a strong cell wall surrounding them. When they take up water by osmosis they start to swell, but the cell wall prevents them from bursting. Plant cells become "turgid" when they are put in dilute solutions. Turgid means swollen and hard. The pressure inside the cell rises and eventually the internal pressure of the cell is so high that no more water can enter the cell. This liquid or hydrostatic pressure works against osmosis. Turgidity is very important to plants because this is what make the green parts of the plant "stand up" into the sunlight.
When plant cells are placed in concentrated sugar solutions they lose water by osmosis and they become "flaccid." This is the exact opposite of "turgid". The contents of the potato cells shrinks and pulls away from the cell wall. These cells are said to be plasmolysed.
When plant cells are placed in a solution which has exactly the same osmotic strength as the cells they are in a state between turgidity and flaccidity. We call this incipient plasmolysis. "Incipient" means "about to be".
Variables:
To create a fair test certain aspects of the experiment will have to be kept the same whilst one key variable is changed. I have chosen to vary the concentration of the sugar solution. This will give me a vary varied set of results from which I hope to make a decent conclusion. If any of the non-variables below are not kept constant it would mean it would not be a fair test. For instance if one of the potato chips was 1cm longer the surface area of the chip would be larger and there would therefore be more space for osmosis to occur. Doing all the tests at one temperature will control the temperature.
"X For the purpose of my experiment I am going to do all the experiments at room temperature.
"X To keep the water potential of the potato initially will be kept the same by using the same type of potato, which have been treated in the same way, e.g. have all been cut without being washed and peeled.
"X The mass of the potato is a dependent variable, and this means that it will be measured
throughout the experiment. I will measure the mass in grams. The potato chip will be
measured before ...
This is a preview of the whole essay
"X For the purpose of my experiment I am going to do all the experiments at room temperature.
"X To keep the water potential of the potato initially will be kept the same by using the same type of potato, which have been treated in the same way, e.g. have all been cut without being washed and peeled.
"X The mass of the potato is a dependent variable, and this means that it will be measured
throughout the experiment. I will measure the mass in grams. The potato chip will be
measured before it is put in the solution, and after. This will allow us to see whether
osmosis has taken place, and to what extent.
"X The volume of the solution that the potato chips are kept in must be fair. The must be
totally covered in the solution, and the amount of solution will be kept the same because
all the potato chips are the same size.
"X I am also going to use the same balance to weigh my potato chips. This is because the measurements may slightly vary between scales.
TABLE SHOWING THE DIFFERENT VARIABLES THAT WILL
BE CONSIDERED DURING THE EXPERIMENT
Variables Non-Variables
Solution concentration Surface area
Solution volume
Duration of experiment
Temperature
Solution
Weighing scales
Conditions
Preliminary Results
Concentration of solution Mass Before Mass After % Change in Mass
0.00m: 1st attempt 1.66 1.74 4.819277108
2nd attempt 1.58 1.66 5.063291139
0.25m: 1st attempt 1.7 1.62 -4.705882353
2nd attempt 2.06 2.07 0.485436893
0.50m: 1st attempt 1.69 1.62 -4.142011834
2nd attempt 1.78 1.67 -6.179775281
0.75: 1st attempt 1.76 1.6 -9.090909091
2nd attempt 1.71 1.56 -8.771929825
.0m: 1st attempt 1.74 1.59 -8.620689655
2nd attempt 1.4 1.25 -10.71428571
Percentage change in accordance to the varying solutions
Concentration Average % change
0.00m 4.94128412
0.25m -2.11022273
0.5m -5.16089356
0.75m -8.93141946
.0m -9.66748768
These preliminary results give me an overall impression on the change in mass gain or loss when placed in varying concentrations of sucrose solution.
Planned method:
A range of sucrose sugar solutions will be prepared with concentrations 0 molar, 0.25 molar, 0.5 molar, 0.75 molar and 1 molar. This will be done by adding varying amounts of distilled water to varying amounts of sucrose solution. Sections of potato will be cut using a scalpel and will be measured using a ruler. This part of the preparation must be done very accurately as a change in the surface area may allow more or less osmosis to occur. The mass of each chip will be measured as well so that more results can be obtained. Three chips will be placed in each test tube each time so that I can take an average for each tube. I will use 10 ml of each concentration of sugar solution and once in the test tubes they each will be labelled. The potato pieces will then be placed in the different test tubes and then left for 30 minutes. Then the potato pieces will be removed, the surface solution removed using paper towels and then they will be re-weighed. If I then have time afterwards I will repeat this experiment again as to obtain a second set of results. This will hopefully produce more accurate results from which I will be able to draw a more accurate conclusion.
Skill Area O: Obtaining evidence
Method:
. I took two average sized ground potatoes and checked that they were both healthy and hard.
2. Using a standard kitchen knife I peeled the potatoes and cut each one into an even block approximately 7cm by 5cm by 4cm on a white tile.
3. Using a scalpel and ruler I cut the potato into ¡§chips¡¨ which were 5 cm long. I had to be very careful whilst cutting the potato as the scalpel is exceptionally sharp. I then had 15 chips.
4. Taking a test tube rack I placed 5 test tubes and then labelled them 0 molar, 0.25 molar, 0.5 molar, 0.75 molar and 1 molar.
5. Using a measuring cylinder I measured out different amounts of sucrose solution and distilled water which I then poured into the test tubes in a percentage ratio giving me the various molar concentrations.
6. I then weighed every potato chip on an electronic balance and recorded the weights.
7. I swiftly put 3 potato chips into each beaker and then started my stopwatch. 3 chips were used to create an average which gave me a better set of results and more accurate graphs.
8. Whilst waiting I set out some paper towels with which I was going to dry the paper and I drew up a basic table for my results.
9. After 30 minutes I drained out the solutions in the sink and placed all the chips on the paper towel in the order I had put them in the test tubes as to not confuse myself as to which chip came from which solution.
0. I dried each chip with the paper towel and then placed each one on the scales so that I could weigh them.
1. Each potato was measured accurately on the electronic scales and then the weights were recorded.
2. As I had time after doing the first set of results I redid the experiment under exactly the same conditions. This gave me secondary set of results which gave me a more accurate view on the changes.
Precautions:
"h As was stated in my planning section of the coursework, I had to keep all of the different non-variables the same, to make sure that none of them affected the results of the experiment in any way.
"h Whilst cutting the potato, extreme care and precision had to be taken with the scalpel as it is very sharp and could easily cause a serious wound.
"h The measurements for the solutions had to be perfect as to not change the out come of the experiment.
"h I had to ensure that every time I handled the potatoes my hands were clean and dry. This was to stop any kind of contamination and made sure that I did not pass on any extra water onto the potatMain Tables of Results for all Concentrations
0.00m concentration mass before (g) mass after (g) change in mass (g) % change in mass
1.46 1.52 0.06 4.109589041
2 1.64 1.75 0.11 6.707317073
3 1.72 1.85 0.13 7.558139535
4 1.64 1.89 0.25 15.24390244
5 1.63 1.85 0.22 13.49693252
6 1.75 1.95 0.2 11.42857143
average 1.64 1.801666667 0.161666667 9.757408672
0.25m concentration mass before (g) mass after (g) change in mass (g) % change in mass
1.56 1.46 -0.1 -6.4102
2 1.66 1.64 -0.02 -1.2048
3 1.6 1.61 0.01 0.625
4 1.51 1.15 -0.36 -23.841
5 1.63 1.68 0.05 3.06748
6 1.34 1.39 0.05 3.73134
average 1.55 1.48833 -0.0616 -4.0053
0.5m concentration mass before (g) mass after (g) change in mass (g) % change in mass
1.65 1.45 -0.2 -12.121
2 1.66 1.52 -0.14 -8.4337
3 1.88 1.71 -0.17 -9.0425
4 1.42 1.36 -0.06 -4.2253
5 1.66 1.51 -0.15 -9.0361
6 1.6 1.52 -0.08 -5
average 1.645 1.51166 -0.1333 -7.9764
0.75m concentration mass before (g) mass after (g) change in mass (g) % change in mass
1.64 1.36 -0.28 -17.073
2 1.49 1.34 -0.15 -10.067
3 1.87 1.74 -0.13 -6.9518
4 1.39 1.26 -0.13 -9.3525
5 1.8 1.63 -0.17 -9.4444
6 1.38 1.18 -0.2 -14.492
average 1.595 1.41833 -0.1766 -11.230
.00m concentration mass before (g) mass after (g) change in mass (g) % change in mass
1.52 1.19 -0.33 -21.71
2 1.64 1.39 -0.25 -15.243
3 1.66 1.49 -0.17 -10.240
4 1.61 1.46 -0.15 -9.3167
5 1.66 1.49 -0.17 -10.240
6 1.56 1.42 -0.14 -8.9743
average 1.60833 1.4066 -0.2016 -12.621
This graph shown above gives the line of best fit for the percentage change in mass of the potato chips over the course of the thirty minute experiment. The graph is a curve that slopes downwards and does not go through the origin. Because the line is not straight and does not pass through the origin, it means that the percentage gain and loss in mass and concentration are not directly proportional. However, there is a pattern on my graph, and this is, as the concentration of the solution increases, the percentage change in mass decreases. The graph shows that the percentage gain and loss in inversely proportional to the concentration. The gradient does change in my graph. It gets less steep as X axis gets bigger. This is because the potato chip is becoming as flaccid as it possibly can, and so the change in mass of each molar concentration is becoming closer and closer together. From the line of best fit that has been added in, it can be seen that all of my points were very close to creating a perfectly smooth curve. This shows that my results are fairly reliable. My graph fits in with my prediction of the experiment graph.
It shows that the potato cells increase in mass in solutions with a high water concentration and decrease in mass in solutions with a low water concentration. When the concentration reaches above 0.75 M, there appears to be no further water loss, suggesting that the cell is fully plasmolysed. From the graph an estimate to the concentration of the potato cell can be made as 0.13 M, as this is the point where the potato is not increasing or decreasing in mass, this is known as the isotonic point. This is where no osmosis is taking place, both the potato and the solution have an identical molar concentration. The next point, 0.25 M looses approximately 4.0 %. This shows that the water potential of the salt solution in the beaker is weaker than that of the potato chip. The next, 0.50 M, looses approximately 8.0 % in mass. This shows that the salt solution has an even weaker water potential than 0.25 M and that osmosis took place. This is why the potato lost even more mass, and it shows that the water potential in the beaker is less than that of the potato chip. This pattern carries on through the graph, and even more mass is lost, as more water moves out of the potato into the solution. My results also match with my initial predictions.
This graph of the change in mass helps prove the point of complete plasmolysis, whereby the potato cannot expand and take in any more water. As you can see as the molar concentration increases the change in mass decreases. From right to left the first two points on the graph are very spread out indicating that there was a large change in the mass. This decreases throughout the increasing molar concentration until the change is minuscule (about 0.02g).
This graph above shows a clear indication that there was an overall decrease in mass during the experiment. At the point 0.00 M the line for after the experiment is above the line for before the experiment unlike any of the others. This is because the water potential of the sugar solution is higher than that of the potato chip.
Skill Area E: Evaluation
The experiment was very successful in my opinion. I obtained a large quantity of very accurate results from which I was able to create informative graphs. I think I took easily enough results for the amount of concentrations that I was using, and the time that I used for the experiment to last was enough to allow sufficient osmosis to occur. However if I was to repeat the experiment I might well increase the time of the result to allow more osmosis to happen and possibly find out the saturation point of the chips. The range of concentrations was adequate but I would possibly create more concentrations if I repeated the experiment so that I would have more varied results, i.e. 0.10m, 1.15m, 1.20m, and so on. This way would have allowed me to also find out the isotonic point far more accurately as the one that I estimated is very approximate.
The cutting of the potatoes was the most difficult part of the experiment as although I was recording my results by mass, it could well have affected the surface area and so the overall rate of osmosis. If I were to repeat the experiment I would have possibly found a machine to cut the potato as it would ensure that all potatoes would be the same weight and dimensions. As well as the potato I could have found a more accurate way to measure out the solutions and to determine the molar concentrations. Perhaps I could have used a burette. This would ensure that I have an accurate amount of fluid in each test tube. I could also weigh each chip on a more accurate scale, e.g. not to 0.00g but to 0.0000g.
There were not any out of the ordinary results, but some were not as close to the line as others. This may have been caused by human. When the potato chips were removed from the test tubes and dried I may well have dried some potatoes more thoroughly than others and so some would have more excess water, which would add to the mass. If the experiment was repeated I could find another way to dry the potatoes that would ensure that all were dried in the same way for the same time. However with all this said I think that the experiment was truly successful and I was very pleased with the complete comparison of my results with my initial prediction.