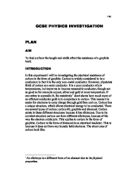
For the width, I predict that as the width increases, the resistance decreases. I think this because as the width does increase, the free charged electrons have more carbon ions to collide with, and so the resistance would decrease. I predict that the graph would start with a low resistance with the largest width, and then decrease until it starts to level out.
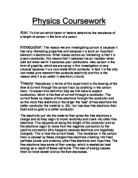
For the resistance against the reciprocal of width I think that the resistance will rise when the reciprocal of the width increases. I think that the graph would look like this.
Fair testing
To make this experiment a fair test I will only have independent variable and one dependent variable for each series of results. I will test how the length and width affect the resistance, but only one at a team. In other words, when investigating how length affects the resistance, the width would be kept constant and visa versa. This is because otherwise I will not be able to extinguish whether there was a change in resistance due to the change of length or width. I must not the metal whilst I am doing the test as I also conduct electricity because I am moist and so I must avoid contact with the metal. I must keep one experiment on the same carbon track and not use a new carbon track whilst in a middle of a set of results. This is because if a new carbon track was used, in the middle of a set of results, then the thickness (height) of the carbon track would be different. Doing these would make this investigation a fair test.
Preliminary Results
For this experiment I needed to decide what material to use. I decided to test the materials three times on the same carbon track and find the average results. Here is a table to illustrate my results. The length of the carbon track was kept constant at 6cm as too the width was kept constant at 1cm
Using these results I have decided to use the copper hoops. This is because these are the most accurate because they cover up lots of the carbon track. The pins are so thin that they connect to parts of the carbon track where there is no carbon and parts where they connect to just carbon. This varies the results greatly and so this is why I shall not use these. The most commonly used would be the copper with the large surface are because it covers the carbon track more than any of the other materials. So, I shall investigate the resistance in the change of length and width of a carbon track with copper hoops. I shall compare these results with the copper with the large surface area.
Method:
Apparatus:
- Ohmmeter
-
B pencil
- Graph card
- Copper (hoop and large surface area)
- 2 leads
- 2 Crocodile clips
- Scalpel
- Ruler
To start this experiment I will set up the apparatus as shown in the diagram. If I were to take the resistance of length, I will start with 1cm going up to 21cm in odd numbers. I will part the copper (hoops) by the measurement that I want to use, on the carbon track, by using the grid on the graph paper as each square is 1cm3. I will note the result on the ohmmeter, making sure I’m not touching the crocodile clips or copper hoops. I will then move the copper hoops on a different part of the track, keeping the same measurement, and note it again. Then I will move it to a different part of the track, still keeping the same measurement, and note the result. Using these three results for the same measurement I will find the average of them and then this will be my final result for that measurement. I will do this for each measurement.
For the width I will make a carbon filled square of 12 by 12, but only taking measurements of 1-10. I shall do the same method as taking the length results (moving the copper hoops at different points of the line, three times for each measurement, and then finding the average). The results are noted down and put into tables and graphs.
Precautions and special techniques
To obtain different lengths of carbon track I will make the carbon track a lot larger than my largest reading that I am to take, so that I can take three readings of a certain length to investigate in different parts of the track. To make sure the carbon is a uniformly thick as possible I will take a long time in pressing down the carbon on the pencil until I can see that there are no white spaces and that it becomes very dark and slightly shiny. To obtain different widths of carbon, I will make a square box, on the paper, of carbon and cut off 1cm after each result. The pencil I will use will be a B pencil so that it gives off more carbon more easily. I will make sure that the lines are parallel by placing my ruler on the edge of the line to be made, and keep that as a guide line so that the carbon track does not over run the line. I will use a digital microscope to look more closely at the carbon track to see how uniform it is.
Safety
This is quite a safe experiment to undertake, but as this experiment is taken in a laboratory, the usual laboratory rules must still be considered and followed. Any careless mistakes in this experiment could have serious consequences. Carbon is dangerous if inhaled as it would cause irritation of the respiratory tract. Mild irritation and redness on contact with skin and most seriously chronic exposure is known to cause disease and cancer of the lungs. Although a fairly large amount of carbon is needed to do this, you must be sensible whilst handling carbon and to still wash it off quickly if it gets on your skin.
Results
Results 1
The reciprocal of width against resistance (1/width)
Results 2
The reciprocal of width against resistance
Copper (large surface area)
The reciprocal of width against resistance
Conclusion
Results 1
Length
The length graphs for results 1 and 2 (graph 1 and 4) were very accurate and very close to what I would have expected to look like, but when the best fit lines were added, they did not pass through zero, suggesting that there may have been some degree of experimental error in this experiment. This still shows that my hypothesis was correct and that my idea of what the results would be was also correct.
Width
The width graph for results 1 (graph 2), was not as accurate, as it is not a perfect curve but only roughly shows the curve, however the best fit line does represent what I would have expected which was a curve. For graph 5 it showed a more accurate curve, but still not a perfect curve so a best fit line was added. This showed a good curve. However, with these lines I could not show that the width and resistance have an inversely proportional relationship so I had to plot graphs of resistance against the reciprocal of the width (1 divided by the width). These graphs show that as the width slowly increases near the beginning, the resistance drops quite steeply whereas near the end the line is not so steep showing that the resistance in levelling out. This makes a curved graph.
Reciprocal
The best fit lines on these reciprocals of the widths (graph 3 and 6) did not pass through zero which, once again suggests that there may have been some experimental inaccuracy. This basically proves that my hypothesis was correct or otherwise the correct idea. This shows that the width and resistance are inversely proportionate, which means that as the width increases, the resistance decreases.
Result 3 (large copper)
Length
This came up very varied results in my length graph. This could be because the large surface area of the copper may not had sufficient connection on the carbon track due to the difficulty as a part of the copper may have a curve at the end so parts may not be connected. Otherwise the line of best fit does show what I would have expected.
Width
The width graph is not what I would have expected as they did not show much of a curve apart from the best fit line. This does not prove that the resistance is inversely proportionate to the width so I plotted a graph of the reciprocal of the width to show the inverse proportion.
Reciprocal
The best fit line on this reciprocal of the widths (graph 9) did not pass through zero which suggests that there may have been some experimental inaccuracy or the copper plates were not very accurate. This basically proves that my hypothesis was correct. This shows that the width and resistance are inversely proportionate, which means that as the width increases, the resistance decreases.
Comparison
Graphs 10, 11 and 12 show the comparison between the three results.
Length
The lengths for results 2 show that the resistance was greater than the other two results. This may be because the carbon track may not have been as thick as the others. This shows a great difference between the others and has the highest resistance out of all of them. The lengths for results 1 show a good straight line compared to the large copper results. Results 2 have quite a low resistance n its length. The large copper results show a different sort of line, almost a curve at the end of it compared to the others. This shows that the large copper has the lowest resistance which may it hard to take readings as the results were so low, so this shows a few anomalies.
Width
Once again, results 2 shows the most resistance due to the facts mentioned in the Length section. This is closely followed by results 1 which shows that there is not much difference in resistance in the widths of results 1 and 2 which may contradict my theory a bi, of the thickness of the carbon track affecting the resistance, but still shows that this does have an affect. In other words, the thickness of the carbon track does not have as much affect on the resistance in the width, whereas it does on the length. Again, the large copper has the lowest resistance.
Reciprocal
This basically shows the same theories as in the topic of Length just discussed above. The results 2 have the highest resistance, and then followed closely by results 1, and then the lowest, by far is the large copper.
My results show that the copper hoops were the right choice as they were easier to take readings down whereas the large copper was hard to take readings as they were so small.
Evaluation
There were anomalies in my results, mainly the large copper as it was all basically an anomalous result as it was very difficult to take the right readings. To overcome this I could have lowered the reading measurement