Where: T = Time period
L = Length
g = gravity
This can be compared to the equation of a straight-line graph, y = m x + c.
T =
y = m x + c
Where m = gradient of graph
c = intercept
y = vertical axis – time period T/s
x = horizontal axis – length L/m
An extra column will be needed in the results for the values of L as the graph will be time against length. The gradient of the graph can be used in the time period equation to find the acceleration due to gravity.
Results
Analysis of Results
The graph is time against length, so using the equation T = 2L/g
The gradient of the graph can be calculated from ΔΥ and is equal to 2 ΔΧ g
ΔΥ = 1.18 = 1.98
ΔΧ 0.595
1.98 = 2 = 6.2
g g
g = 6.2 = 3.13
1.98
g = 3.13²
= 9.8ms²
Conclusion
The value I obtained for the acceleration of the simple pendulum due to gravity is 9.8ms², which is good. This shows that the experiment was accurate and verifies the equation for the time period. The value is slightly less than the accepted value of 9.81ms² for the acceleration of gravity which could be due to a number of uncertainties and errors that may have occurred throughout the experiment despite efforts to keep them at a minimum.
Timing for the 20 oscillations of each length was repeated because although it should take the same time, as amplitude does not affect the time period, we knew errors would occur and calculating an average time from 2 sets would be more efficient. The main uncertainty in the experiment was reaction times as reaction times for starting and stopping the stopwatch must be quick because it is does not take long at all for one oscillation and errors could occur very easily.
We began timing the oscillations from the centre instead of the ends because this is where speed is at its maximum but acceleration is at its minimum which would make the results more accurate.
The amplitude was kept small so as not to move too fast and for ease of counting. We also tried to keep the amplitude at a similar size each time because although amplitude does not affect the time period, changing the length of the pendulum does. So if the amplitude were greatly increased for one length the results would not follow any kind of pattern that you would expect if the amplitude were kept the same for each length.
We also counted 20 oscillations rather than just one because the error that arises through being unable to start and stop the watch when the pendulum is exactly in the intended position is greatly reduced.
The measurement of the length of the pendulum could have a degree of uncertainty in it from its initial measurement to then being set into motion where it may be slightly stretched, however if there was an error in the measurement it would be very small.
In the same way it is possible that air resistance could cause an error but because the ball was quite small I believe the error would be minuscule.
When the ball was set into motion it did, on occasion, have a tendency to move in a circular path so we would begin the experiment again.
The process of finding my value was made easier by converting the results into a graph, where the advantages outweigh those of calculating each set of results, one being time consumption.
The use of a graph with a line of best fit enables you to see relationships between the results, constants, and the possibility of predicting the behaviour of results, showing new values. Instantaneously the line of best fit can reveal results that are inaccurate. A graph is easier to understand and make sense of results.
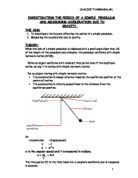
My graph has a straight line through the origin that does seem to be showing a pattern between the length and time. As expected the time period increases as length of the pendulum is increased. All my results are either very close or on the line of best fit showing that there were no serious errors in the experiment.
Task 2
Pendulums provide good time keeping because they perform simple harmonic motion and therefore can always have the same time period irrelevant of their mass.
Grandfather clocks have a time period of 2 seconds.
The length of the pendulum needed can be obtained from the following equation
T = 2L/m
2 = 2L/9.81
2 = L/9.81
2
(0.32)² = L/9.81
- = L/9.81
- x 9.81 = L
L = 0.981 m
Task 3
To calculate the maximum amplitude of the oscillations if the mass is not to lose contact with the tray, first the time period must be worked out, by using the following equation.
T = 2m/k
T = 21.3/15Nm¹
T = 20.086
T = 20.3
T = 1.9s