I will then be able to evaluate my results, produce graphs and come to a conclusion for this investigation.
Precision
In this experiment I will need to make sure that I am very careful with what I do and that all my actions are precise. There are many key factors or variables which can affect this experiment; some of them might lead to creating the wrong environment and therefore obtaining inaccurate and different results. All of the key factors or variables are listed below.
-
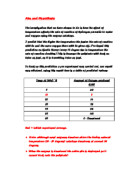
Temperature
If the temperature is too high then the enzymes will denature and there fore not work. If the temperature is too low, then the enzymes will work very slowly taking more time. As the temperature increases, molecules move faster.
To control this variable I will make sure that the water is always warm, preferably at room temperature (23ºC).
- Surface Area
The surface area is directly proportional to the rate of reaction. As the surface area increases so does rate of reaction. This is because the enzymes spread out. The surface area can be either increased or decreased.
I will be increasing the surface area to see what affect it has on reaction and how much it differs.
- Enzyme Concentration
The higher the level of enzyme concentration, the faster the rate of reaction. This is because there are more enzymes to break down the compound quicker.
I will not be varying the enzyme concentration but it may differ itself.
- Concentration Level of Hydrogen Peroxide
Hydrogen peroxide is the compound. The higher the rate of hydrogen peroxide the longer it takes the enzyme to break it down. This is because there is too much of it to break down.
I am not going to vary the concentration of hydrogen peroxide as I would just like to compare the surface area.
- Independent variables (what I have used)
These are things like volume, mass, temperature, shape, surface area, vegetables, meat and concentration. These are all changeable and have different effects when altered.
I will be using heart and aubergine.
-
Dependent variables
These are what I collect, they are given off. Examples of dependent variables are volume of oxygen produced, bubbles produced, time taken and rate of production. These are not changeable by myself and happen by themselves. They can not be chosen or changed.
Background Knowledge
An enzyme is a protein molecule which breaks down big molecules into smaller ones. Each enzyme performs just one particular reaction therefore they are very specific. Enzymes cannot be killed and the do not die. Instead they denature, therefore they work at a different rate.
There are two types of enzymes:
Intracellular enzymes – which control reactions, that occur inside cells.
Extra cellular enzymes – which control reactions, that occur outside cells (for example, digestive enzymes work outside cells in the gut).
There are approximately 3000 enzymes which have been characterized. These are grouped into six main classes according to the type of reaction catalysed.
They are known as biological catalysts. A catalyse is an enzyme which speeds up reactions. Catalase is found in food and meat such as heart and potato, and is used to remove hydrogen peroxide from the cells. Hydrogen peroxide is a component of bleach produced by cells. Catalase speeds up the decomposition of hydrogen peroxide because of the shape of the hydrogen peroxide molecule. This type of reaction, where a molecule is broken down into smaller pieces is called an anabolic reaction.
Hydrogen Peroxide is known as 2H2O2
Hydrogen Peroxide + Catalase = Oxygen + Water
2H2O2 + Catalase = O2 + H2O
2H2O2 O2 + 2H2O
Enzymes need special conditions to work properly.
- They must have the correct pH
- They must have the correct temperature (36.5 ºC)
- They only work on one kind of food (pepsin will only digest protein)
- They are poisoned by some metal ions.
Temperature affects an enzyme because if the temperature is too high then the enzyme will change its rate of reaction and denature. This means that the temperature for an enzyme must be just right. The temperature at which enzymes work effectively is body temperature - 37ºC.
Surface area affects enzymes, because the larger the surface area the more spread out the enzymes will be. This means that if the surface area is small then the enzymes will be squashed together in a small environment.
OBTAINING EVIDENCE
After doing the planning, I carried out my experiments and obtained the results. I had to make sure that all the apparatus was set up, safety precautions were taken and it was a fair test.
Safety Precautions
Before setting up the required apparatus to carry out the experiment I had to take several safety precautions to make sure that nobody gets injured or nothing is spilt. To do this I lay newspaper down onto the table so that if anything was to spill it would not directly go onto the surface of the table and would be absorbed. As I was dealing with meat I wore gloves to reduce the chance of infection to myself and others, even after cutting and using it I disposed of the gloves by putting them in the bin and washing my hands thoroughly. The heart had been defrosted as it was kept in a freezer so that it didn’t go off.
Whilst cutting the heart and other materials I took care not to accidentally cut myself, I made sure that my fingers were out of the way. When weighing the meat I first put it onto a paper plate then weighed it, so that the electronic balance didn’t get dirty. I emptied out the contents of the experiment in the sieve and the sink so that it was clearly disposed of. My fellow students and I made sure that we did not run about or push on another and that the apparatus was not close to edges of the table, so preventing any breakages. By taking all of these safety precautions I ensured that my fellow students and I were at a low risk of getting injured in any way.
Hypothesis
- Heart cubes will react faster and produce more oxygen bubbles per minute than either the aubergine.
- The amount of oxygen produced by the aubergine will increase when it is crushed, as the surface area is greater.
The Experiment
To begin with I set up the apparatus as listed on page 1, in addition to that list I used a pestle and mortar, electronic balance, heart muscle, aubergine and some sand. I filled half a tank of warm water and inside it I placed a bee hive shelf. I fixed the rubber arming onto the side arm tube and then fed the other end of it through the bee hive shelf in the tank, so that the other end came out through the hole at the top of the bee hive shelf. Then I filled the measuring cylinder with water and placed it over the hole in the bee hive shelf so that the end of the rubber tubing was inside the measuring cylinder. I took great care not to lose any of the water in the measuring cylinder or get any air bubbles inside it, as this would have interfered with my results.
I then cut some small pieces out of the heart muscle and placed them onto some tissue on a paper plate. I then weighed the pieces on the electronic balance. I first put the paper plate alone onto the balance and then took off that weight so it was 0g. After doing so I placed the pieces onto the plate, and got their weight. The weight came to 10g. I then placed the heart muscle into the side arm tube and added 10cm³ of hydrogen peroxide. I quickly placed the rubber bung on the side arm tube and started the stop clock. I counted the number of bubbles produced per minute for five minutes. I took down the results whilst doing this.
The next experiment which I did was again using the heart, but this time I crushed it to increase the surface area. I had to use the pestle and mortar to crush it and I placed a sprinkling of sand to make it easier to crush. I again weighed it in the same manner and the weight was 10g. I then placed it into the side arm tube, added 10cm³ of hydrogen peroxide, closed the tube, started the stop clock, counted the number of bubbles produced per minute and took down the results. The results had changed to those of cubed heart.
In my planning I had said that I will also be carrying out tests for aubergine and comparing the result to those of the heart. I used the same apparatus and set it up in the exact same way as I did previously. I then cubed and weighed the aubergine. The weight was 10g (weighed in the same way). It weighed the same as the heart. I placed it into the tube, added 10cm³ of hydrogen peroxide, counted the number of bubbles and took down the results.
Again I took another 10g of aubergine, but this time I smashed it up. Using the same apparatus and technique I carried out the experiment and took down the results by counting the number of bubbles per minute, for five minutes, with the help of a stop clock.
All four experiments were done with great care and I managed to obtain all the results that I was looking for.
How I Collected Evidence
In the enzyme reaction the catalase (which is in the chosen material, e.g. heart, aubergine) combines with the hydrogen peroxide to produce oxygen, which is then given off. The reaction takes place as the catalase particles collide with the hydrogen peroxide particles, this is what makes the oxygen come about and this is why the hydrogen peroxide starts to froth.
To collect the results I used a stop clock to keep track of time. At the end of every minute I wrote down the number of bubbles produced in a table, the oxygen bubbles were appearing in the measuring cylinder as the oxygen travelled from the side arm tube through the rubber tubing and into the measuring cylinder full of water, causing it to appear as bubbles.
The problem I had with counting the number of bubbles produced was that sometimes the bubbles would appear very quickly in a big group making them look like they were stuck together. This meant that I had to count quickly and pay a lot of attention to the bubbles to make sure that they weren’t really joined up. I made it easier for myself to count the number of oxygen bubbles produced and keep track of time, as my partner was helping me so that I did not accidentally miscount the bubbles or make a mistake. To do this I counted the total amount of bubbles produced in each minute and wrote it down. After each minute I started to count again from one. This allowed me to make certain that I had not gone over time or under time with the rate of bubbles produced per minute.
I carried out this experiment twice and both times I got similar results. I have shown the results from the second time of doing the experiment as this meant that they would be slightly more accurate as I was certain of everything going on. On the next page there is a diagram of the experiment.
Systematic Repeating of Procedure
To make sure that both tests were the same and fair I had to carry out the exact same procedures twice. I weighed the heart and aubergine twice using the same method; firstly placing a paper plate onto an electronic balance and then taking away the weight of plate and adding the material, to weigh. I also made sure that both times the amount of water uses was the same by measuring it and I also made sure that the temperature of the water was the same both times. The water was always warm. For both times which I carried out these experiments I used the same measurements and procedures. This allowed me to carry everything out in an orderly manner which I knew was correct. The aubergine and heart pieces were cut so that they were roughly the same size. I use the same amount of pieces both times to make sure that my results did not change. If I had not been so careful then my results would have changed and shown an error. This would have meant that I was not carrying out a fair test and that something had gone wrong somewhere. I would have then had to redo the whole experiment. I think that doing the experiment twice was a good idea as I was able to see any changes or errors. However doing the experiment the third time would have been a very good idea as I would have been able to see even the smallest changes and have produced more accurate results. I was not able to do this as I had unfortunately run out of time.
Results
Below are two results tables; one for the heart and one for the aubergine. In these tables the data is raw. This is to say that these are the exact results taken at the time of conducting the experiment and have not been altered or changed in any way by carrying out calculations.
Heart results:
In the table above the results for the smashed heart show that the surface area had increased, however the oxygen production level has fallen.
Aubergine results:
In the table above the results for smashed up aubergine, show that the surface area had increased, and that the oxygen production level has also increased.
Precision and Accuracy
I shall tell you about how my experiment went and what could have been improved. I think that my experiment went quite well and that I obtained the expected results. This meant that my hypothesis was proven to be correct and that what I had expected is what I achieved.
I arranged the practical in a flowing order so that everything fitted in and went smoothly. I cut the heart and aubergine first, then filled the tank with water and set up the apparatus. I placed the materials into the side arm tube and poured in the hydrogen peroxide only when I was ready to start the experiment. This meant that I would not miss any of the bubbles being produced and that the experiment was carried out safely.
I carried out the each test twice to make sure that everything went well and it was a fair test. To make the experiment a fair test I didn’t shake any of the tubes whilst the reaction was taking place and also I carried out each test twice to make sure that nothing had gone wrong. I used the same amount of aubergine and heart at all times along with the same amount of hydrogen peroxide at all times. I increased the surface area by smashing up the same amounts of material.
I could have improved my experiment by also seeing what would happen if I changed the mass of the material or the volume of hydrogen peroxide used. I could also have tried out different concentration solutions, so that the catalase would react with part water and part hydrogen peroxide.
I had slight difficulty setting up the apparatus as I had to make sure that none of the water fell out of the measuring cylinder when I turned it over onto the bee hive shelf. Also smashing up the heart muscle was also slightly difficult as it was very strong and tense. I added some sand so that it would be easier to crush and it did help slightly. Although I think it would have been easier if I had smashed small pieces at a time.
Also when I was taking down the results I found that sometimes the oxygen isn’t produced as quickly as it is at other times, as the pressure has not yet built up. However I didn’t shake the tube and don’t think that it would have been a good idea to do so as it would have made the experiment an unfair test. On top of this I had to make sure that the weight of each material was the same and this was a bit difficult as I had to cut similar amounts. I made sure that I had cut a bit more so that if the weight was too much than I could easily take off the excess.
My hypotheses were proven to be correct as the heart cubes reacted faster and produced more oxygen than the aubergine did. This can be seen in the results table. Also the smashed aubergine produced more oxygen as it had a larger surface are, this can also be seen in the results table.
I was pleased with the results produced by the experiment and also how smoothly everything went without any accidents or major problems and difficulties.
ANALYSING & CONSIDEREING EVIDENCE
I will now take into account my results and analyse them to be able to produce more tables and graphs to show the various rates of reactions and to be able to see the difference in oxygen production between heart and aubergine. By doing all of this my hypothesis will be proven correct or incorrect. I will be able to understand the difference in rates of reactions and also in the amount of oxygen produced, in comparison to the variable used.
Hypothesis:
- Heart cubes will react faster with and produce more oxygen bubbles per minute than the aubergine.
- The amount of oxygen produced by the aubergine will increase when it is smashed, as the surface area is greater.
I have shown results tables with my results with calculations.
Calculated Results:
T1. Heart muscle:
T2. Aubergine:
My results show that my hypothesis was correct. In comparison to the cubes of aubergine, the cubes of heart had a faster reaction time, producing more oxygen bubbles. This can be seen as; the numbers of bubbles in the first minute of the heart were almost 8 times more than that of the aubergine. The oxygen production then increased in the second minute of the heart whilst only in the third minute of the aubergine. It then decreases slowly, therefore the number of bubbles also decrease. However, the smashed heart produced only a slightly less number of oxygen bubbles, compared to the smashed aubergine. This shows that although the surface area increased in both substrates, the amount of catalase released was greater in the aubergine.
The smashed aubergine produced a greater amount of oxygen bubbles as its surface area had increased. This suggests that the larger the surface area the greater the release of enzymes and amount of oxygen produced. The aubergine had reacted faster with the hydrogen peroxide, allowing it to produce more oxygen in a faster time span. The enzyme activity increases as the enzymes are multiplied and spread out, taking up more of the hydrogen peroxide. This proves that my hypothesis is correct.
The word equation for this reaction of catalase and hydrogen peroxide (2H2O) is:
Hydrogen Peroxide + Catalase = Oxygen + Water
2H2O2 + Catalase = O2 + H2O
2H2O2 O2 + 2H2O
This equation shows that hydrogen peroxide combined with catalase gives out oxygen and water.
The reaction starts off slowly as the catalase is just beginning to combine with the hydrogen peroxide and takes a bit of time to produce oxygen. The reaction then speeds up for about a minute and then again slows down. This means that it the catalase is not as reactive as it was in the beginning because a lot of it has been used up and there are any enzymes left to mix with the hydrogen peroxide. This is why the reaction slows down. Therefore all my results start off slow, increase and then decrease. This is as good sign as it shows that the catalase is working correctly.
It would have interesting to see what would have happened if I had grated the aubergine instead of crushing it. Unfortunately I was not able to do this as I did not have enough time.
I have drawn graphs from my results to show the outcome in a much simpler way. This means that I can discuss my output furthermore. There are four graphs each showing the gradient or rates of oxygen production. I have created a table of the oxygen production rates as it will allow me to analyse the differences.
Graphs:
Below is the graph of T1. It shows the cumulative frequencies of cubed and smashed heart.
The gradient of the graph is worked out by selecting a point and then drawing a line from it. The gradient for cubed heart is: 146
- = 48.6
The gradient for smashed heart is: 97
4 = 24.3
Below is a graph of T2. It shows the cumulative frequencies of cubed and smashed aubergine.
The gradient of the graph is worked out using the same method as above. The gradient for cubed aubergine is: 50
5 = 10
The gradient for smashed aubergine is: 81
3 = 27
Explanation:
All of my graphs follow the same pattern. They slowly curve upwards in a steady line. The graphs show that even though my results look different in a table, they aren’t extremely different when looked at in the form of a graph. The graphs show that the curves increase their slope therefore increasing the enzyme activity. This means that the enzymes have not completely stopped working by are slowing down and will soon lose the power of reaction with the hydrogen peroxide as it foams up and there is no more mixable solution left.
I have worked out the rates for the amount of bubbles produced in one minute as this gave me an average number of bubbles. The formula to work out the rates is:
RATE = Total Number of Bubbles
Total Time
For example: RATE = 50+53+43+33+21
5 = 40
Rate of Bubbles Table:
From the table you can see that the rate of bubbles per minute for the cubed heart is greater than that of the smashed heart. This is not what I expected it to be, as I thought that by smashing the heart and increasing the surface area the oxygen production would also increase. I think that I was wrong because the catalase probably became too small to react quickly enough. On the other hand, the smashed aubergine rates rose compared to that of the cubed aubergine. This suggests that the catalase was boosted by multiplying and taking more than a few forms, allowing it to cover the hydrogen peroxide quickly and easily, producing quick and large results.
Conclusion:
The catalase enzyme works faster with smashed up aubergine than with smashed up heart because the activity rate is faster. For example the surface area is larger and so the enzymes will split up and move about taking over other smaller areas. The variables determine the speed of the enzyme activity. E.g. temperature – optimum temperature is 35ºC, above 50ºC enzymes will denature (not work anymore). The temperature of the water which I was using was warm. This means that there is more reaction in the tissue as catalase molecules collide faster with the hydrogen peroxide consequently, breaking it down faster.
My experiment produced the predicted results and showed that catalase enzymes work well in the middle few minutes of the experiment. I believe that this is due to the catalase speeding up its release. The results which I achieved told me that the enzymes worked correctly, as they were slow at first then speeded up and then slowed down. My graphs showed that the rate of activity rises slowly. However the rates table proved that larger surface area for the heart doesn’t always mean faster and greater oxygen production. This is probably because the enzymes were divided into too many smaller molecules and therefore did not posses enough power react quickly and rapidly. I feel that some shapes and sizes of meat or vegetable often produce more oxygen than expected as the enzymes are more suited to that environment and that more enzymes are released at a faster rate.
EVALUATING
Here I will evaluate my entire experiment and talk about all of the anomalies which I encountered and the procedure which took place. This will allow me to realise how much I could have improved my experiment, why I faced certain problems and also why I achieved the results which I did.
Procedure
I followed a very simple procedure for this experiment. The procedure is listed in my planning (pgs. 1-8) and my obtaining evidence (pgs. 9-13). This procedure was easy to follow as I just had to set up the apparatus and start the experiment. However I had to make sure that I counted all the oxygen bubbles from the very beginning and that I didn’t miss anything. This was essential for me to obtain accurate results. As the bubbles were sometimes being produced quite rapidly I had to make sure that I kept a constant eye on the measuring cylinder.
Anomalies (Odd Bits/Problems)
I feel that I managed to obtain quite accurate results and that my method for making sure this was the case was also quite good. To do this I counted the number of oxygen bubbles produced whilst my partner watched the time. The problem that I faced was counting every single bubble, especially in the first few minutes as the bubbles were produced very rapidly. This was only a problem as sometimes the bubbles would be very close together and small, making it harder to count them all. However, I did manage to count all of the bubbles except one or two. So my results were actually, accurate. To overcome this problem there were two people taking down results just in case one of us missed something.
My graph for smashed heart (pg. 16) is a curved line, however if the top two points weren’t there, or in a slightly higher up, then my graph could have been a straight line. This shows that the bubbles were produced in similar pattern until the end, where the process slowed down. This caused the cumulative frequency to produce the calculations which it did and therefore producing a graph which has a curved, not straight line. This does not mean that my graph is wrong but that it would have been interesting to produce a straight line graph. However I did expect the graph to have a slightly curved line as it would show the speeding up and slowing down of the catalase.
My graph for the smashed aubergine (pg. 16) could have been a perfect curve but it was not, as the last three points were not in the correct place for the perfect curve to be there. This meant that the graph looked slightly like an ‘s’ shape. There is nothing wrong with this graph, and I think that this shows the rapid increase in the rate of reaction and the slow decrease near the end. The graph still produced results from which I could explain and understand my theory a lot better.
Results:
My results table (pg. 14) implies that there was somewhat of a pattern between the smashed heart and the smashed aubergine. This is because the no. of bubbles produced at the beginning, are very similar. E.g. smashed heart: 1 min = 22 bubbles. Smashed aubergine: 1 min = 24 bubbles. The aubergine starts with only two more bubbles than the heart and so there isn’t much difference. The amount of bubbles produced in the last minute was also almost exactly the same for both the smashed heart and aubergine, which suggests that in both variables the catalase slowed down at roughly the same time. My results follow a fairly smooth pattern which is a good sign as it implies that the experiment went well and that the catalase were doing their jobs properly.
My results were easy to collect as I was writing them down as they occurred. Also the results were different for both variables; this was a good sign as it was what I had predicted. The results also proved my hypothesis (pg.14) to be correct.
There are many ways in which I could have improved my experiment and results, five of them are listed below:
- Count the oxygen production more accurately.
- Used different variables for different results and comparisons.
- Worked out averages for all of the results.
- Plotted a graph for the averages.
- Compared the graphs for all of my different results and come to a conclusion.
Advantages and Disadvantages of the Procedure
There were many advantages to this experiment as the steps were quite simple to follow. The procedure was simple and easy to set up and gave accurate results; which is what I was hoping for. There was a variation of results as larger surface area would produce different results according to the catalase activity taking place. These were advantages as it allowed me to take our research further and find out more about catalase activity and enzyme reactions. These factors are what enabled me to ensure that I achieved the correct results and had not made any mistakes. The larger surface area results were good as they enabled me to prove that my hypothesis was either correct or incorrect.
There were also some disadvantages such as: the bubbles not coming out quick enough as there was too much gas building up in the tube and when it eventually did come out it was very fast. This problem was overcome by having patience and keeping a close eye on the tube. I did not shake the tube as we would have had to do it for every single one, and it would have been an unfair test. In fact I was lucky that my tube didn’t get blocked up with gas. There were health risks such as getting infected by the meat but I wore gloves for protection. I was also worried that the catalase would be slow or ineffective in the meat as it had been defrosted and then re-frozen. This was overcome by placing the meat into a fridge after defrosting it, so that it wouldn’t go off and the catalase wouldn’t be affected too much.
Reliability of Results
The results were not totally reliable as some faults occurred during the way and these were probably due to gas not being released out of the tube fast enough, temperature change of the water and other small things which I have mentioned previously on these few pages. I tried to prevent the blockage from occurring by making sure that the right amount of hydrogen peroxide solution was placed with the two variables, on top of that I didn’t shake the tubes because it would have then been a unfair test. On the other hand the results were taken down carefully and there was more than one person counting the bubbles to make sure that they weren’t miscounted.
The results which I achieved were sufficient as they were only taken down for five minutes. This meant that my graph had the correct number of points and was not cramped with too many figures and data. If the results were taken down for more than ten minutes then they would have been insufficient as the graph would have been too squashed together and the results would not have enabled me to come to a conclusion. It would have been very confusing.
Overall View of the Experiment
Looking at both of my graphs I am able to see that the curves for my aubergine graph are very similar to each other. They seem to be following a smooth pattern. This shows that although the results are different the arrangement of the data looks the same, which can not be said for the aubergine graph. The aubergine graph has two different curves. This is because the increase in the surface area had a greater impact on the results than the heart did.
The temperature of the water was roughly the same for all of the experiments and therefore there should not have been too much of a change in the results. I did some research and found that hot water reacts faster with catalase and therefore produces bubbles at a faster rate. Also the gas dissolves faster, increasing gas and heat energy. I think that my experiment has gone well and that my results have been achieved in a fair way and that they are quite good results. My hypothesis (pg. 14) was also proven correct which means that what I already knew about enzyme reactions has helped me quite a lot.
I think that it would have been interesting to investigate further with other fresh meats, cooked vegetables and even fruit. Also it would have been great to see what the outcome would be of using different concentration levels of hydrogen peroxide. This would have been a good opportunity for me to learn more about different rates of reactions on other substances. As well as allowing me to make more hypothesis and obtain different results. As I did not have enough time I was not able to take my research further using the above mentioned substances and methods.
Overall I am quite happy with my results, graphs and the whole procedure as it went smoothly even though there were some hazards in the middle.