The last experiment involved using the wood metre rule as set up in the first experiment, it was pressed to set it oscillating, then gently pressed near the 20cm mark each time the metre rule moved downwards.
Results
All results have been given to 2 decimal places.
The number of oscillations per second is known as the frequency (f) which is measured in hertz (Hz), one hertz = one oscillation per second.
The time for one oscillation is called the periodic time (T). The results show there were 10 oscillations for the time recorded, so if the time is divided by 10 you will get the results for how long one oscillation will take.
I.e. for a time of 6.62 seconds, 6.62 = 0.66 (2 d.p)
10
It took 0.66 for one oscillation to occur.
Therefore to find the frequency you divide 1 by the periodic time, so f = 1/T
An example would be f = 1
0.66
This equals 1.52 and is the frequency for 0.9 metres for the wood metre rule.
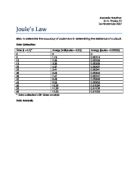
Table 1
Table to show oscillation, length, time, periodic time and frequency for a wood meter rule.
From table 1 you can see that when the length increases the periodic time increases therefore the frequency decreases.
Table 2
This table shows oscillation, length, time, periodic time and frequency for a plastic meter rule.
From table 2 you can see as the length and periodic time increases the frequency decreases as in table 1, this table shows that the frequency is less of that of table 1
The frequency of the wood meter rule is greater then that of the plastic meter rule which is due to the material of the wood as it is stiffer then the plastic.
Four graphs were drawn, they show length against periodic time and length against frequency for both the wood metre rule and the plastic metre rule.
For both the wood and plastic meter rule the graphs show that as the length increases, the periodic time increases
When length increases the frequency decreases for both the plastic and wood meter rule.
The graph shows that the length against periodic time is proportional and the length against frequency is inversely proportional.
Conclusion and comments
The results show that as the length increases the periodic time increases, this indicates that the longer the length the longer the oscillations. It also shows as length increases the frequency decreases, this is due to the fact that in any set time the longer the length the less frequent the oscillations occur. The wood metre rule had a higher frequency then the plastic metre rule ass the wood is made out of stiffer material.
In the last experiment whilst pushing down on the meter rule at the 20cm mark, it kept a constant as you are going with the force.
For the wood meter rule the time at each length was shorter then that of the plastic meter rule, this is due to the thickness and strength of the wood. The plastic meter rule is thinner and more flexible then the wood causing the oscillations to become longer.
Oscillations involved in engineering could be a number of things for example; a bridge, the behaviour of a bridge is not fully specified by the static forces within it. All the parts have both mass and elasticity, and can exchange energy between kinetic energy of the motion, and the strain energy of bending, all bridges can move. They experience the wind, and live loads caused by traffic. These two facts have an effect on the bridge design. Even the steps of pedestrians can affect a foot-bridge.
An example relating to the structure of wood and oscillations is the effect of earthquakes on wooden building in some countries, for a building of a given mass, the force that the building experiences in an earthquake will be determined by the acceleration as force equals mass times acceleration. If the force exceeds the strength of the building, it will fail and be destroyed in an earthquake. Light buildings such as those made from wood typically do better in an earthquake than heavy buildings such as those made from bricks.
The results obtained were not as accurate as they could have been, when the oscillation becomes greater it was difficult to start and stop the stop clock and count 10 oscillations as it was going so fast, therefore the last results are not as accurate as the first. Also it is said that when timing oscillations there is a time delay of 0.1 – 0.2 seconds between visual signals detected by the eye and the brain making a decision, and the muscles moving into action. Anticipation could add another factor as it was to tempting to stop the clock before you got to 10 oscillations.
An example of oscillations referring to musical instruments is the strings and air columns of a musical instrument when producing a note. Sound waves are transmitted by the oscillation of the particles of the medium in which the sound is travelling. Atoms in a solid vibrate about fixed positions of their lattice. The pipe-organ, pan-pipes and whistle use a steady flow of air to create pure tones.