The initial plan is to change the concentration of nitric acid and have the molarity of the nitric acid as the independent variable. However, various preliminary experiments will help to distinguish the range of changes suitable and other constants within the experiment that need to be controlled.
To carry out the preliminary experiments I will use the following equipment and chemicals:
- Conical flask
- Bung
- Delivery tube
- Lubricated gas syringe
- Stop watch
- 2M nitric acid
- Distilled water
- Calcium carbonate chips
- Scales accurate to 2dp
- Measuring cylinders (2)
The apparatus will be set up as followed:
The nitric acid will be measured using a measuring cylinder and poured in the conical flask. The calcium carbonate chips will be weighed and, when we are ready, poured into the conical flask and into the acid. The conical flask will be bunged immediately and the timer started. At regular time intervals we will measure the amount of carbon dioxide produced by reading the gas syringe.
The concentration of the nitric acid will be altered by using the two molarities of nitric acid supplied and diluting them with distilled water to reach the desired molarity.
I will first carry out the experiment with the following factors: 50ml of 2M nitric acid and 5g of calcium carbonate chips. 50ml will be the control for the amount of nitric acid to use and so will 5g be for the calcium carbonate. If there is too much gas produced or not enough to get a good rate of reaction I can alter these factors to change the volume of the carbon dioxide. I will use time intervals of 20 seconds to start with and change them later if it isn’t suitable.
Results for 50ml of 2M acid and 5g of chips:
The amount of carbon dioxide produced is off of the syringe’s scale by the 40 second mark. These results are terrible to calculate the rate of reaction as there are only two values. Changes that can be made to this are that smaller time intervals could be incorporated or smaller quantities of the two reactants could be used. For my second preliminary experiment I will use 50ml of 2M nitric acid and 5g of calcium carbonate chips and see what the results look like taking readings every 5 seconds.
Results for 50ml of 2M acid and 5g of chips:
In this case the finishing point of the reaction is slightly more accurate and there is a larger set of results but a larger span is still needed to get a good shaped curve on a graph and to see how the rate of reaction varies in different points in the reaction. Before changing the amounts of the reactants is considered, a different molarity will be tried to see if this set up would work on lower concentrations. A concentration of 0.5M will be tried- produced using 37.5ml of distilled water and 12.5ml of the nitric acid.
The results were that no carbon dioxide was collected by the gas syringe, which isn’t accurate as the reaction was taking place and carbon dioxide was being produced. This could be explained by either that fact that not enough gas was produced to start to move the syringe, that the syringe wasn’t lubricated enough or that there was a leak in the delivery tube.
If it was that there was not enough gas to start to move the syringe then it shows us that at the start of our timing, unless in the case of the 2M acid experiments where a lot of gas is produced even at the start, we are not accurately measuring the rate of reaction. A way to overcome this is to not start timing until the gas syringe begins to move; that way we have accurate results for all of the time intervals as opposed to saying there is no gas at e.g. 5 seconds whereas there is carbon dioxide produced, but it cannot be measured.
For the next preliminary experiment I will investigate whether changing the amount of calcium carbonate used in the reaction affects how much gas is produced. The same time intervals and volume of nitric acid will be used so a direct comparison can be made to the first two experiments that took place.
Results for 50ml of 2M acid and 2g of chips:
These results are much better as the production of carbon dioxide from the reaction is steady and it takes a lot longer for the reaction to reach a similar quantity of carbon dioxide as before which gives room to look at the rate of reaction at different points of the experiment.
To make sure that this set up works for different molarities I will try using 1M
nitric acid.
Results for 50ml of 1M acid and 2g of chips:
This too shows a good range of results that rates of the reaction can be calculated from. Like in the 2M experiment, there seems to be larger intervals between the carbon dioxide readings at the start and middle of the experiment compared to the end.
For the final method, molarities of nitric acid to be used will be 0.75, 1, 1.25, 1.5, 1.75 and 2. Although it is probable that the results were anomalous, the preliminary experiment involving 0.5M acid was very unsuccessful. However, the preliminary experiment involving 1M nitric acid produced a good range of results which lead to believe that 0.5M should at least of returned something, especially as the reaction was still taking place past the end of the gas syringes measurement capabilities. There the range of concentrations will have 0.75 as the lowest value. Six changes to my independent variable (the acid concentration) will be enough to see how the graph lines compare to each other.
Time intervals of 5 seconds will be used to measure the carbon dioxide in the gas syringe. The preliminary experiments showed this to be successful as measuring the rate of reaction at a certain point in the experiment can be isolated to a specific time more accurately. With larger time intervals, there are big jumps in the data so the 5 second spacing evens it out and the data runs more smoothly.
The experiment finished far too quickly when using 5g of calcium carbonate chips so 2g will be used to in the reactions. The volume of nitric acid will remain 50ml.
Firstly, 2g of calcium carbonate chips will be weighed using a pair of scales accurate to 2 decimal places. This ensures a high level of accuracy and, if at all, the weight of the chips for different experiments will only deviate slightly. The chips will then be put into a conical flask. The nitric acid solution will then be produced using the distilled water and 2M nitric acid. Two separate measuring cylinders will be used to measure the liquids- one for the acid and one for the water. This table shows the different amounts of acid and water needed for each molarity.
A well lubricated gas syringe will be used to collect the carbon dioxide, with a delivery tube leading to the bung, which will be placed in the conical flask. The equipment set up will be the same as the one used in the preliminary experiment and the earlier diagram shows this.
The nitric acid solution will be poured into the conical flask with the calcium carbonate chips and the flask will be bunged immediately. Simultaneously, the first stop watch will start timing. After the gas syringe starts to move, the second stop watch will start timing. The first stop watch will stop timing and the time taken for the gas syringe to start to move will be recorded and analysed later for any significance. Every five seconds a reading will be taken off of the gas syringe and the amount of carbon dioxide will be recorded. The experiment will be repeated for every concentration in order to identify anomalous results easily.
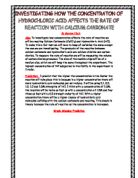
The rate of reaction is expected to increase as the concentration of the nitric acid does. This is because of the point explained earlier in that there are more particles with activation energy in a given unit of space and therefore there is a larger likelihood of two of these particles colliding. Within the individual reactions, the rate of reaction is expected to start off fast and then gradually become slower until the reaction is complete. As the reaction is taking place, the nitric acid is being used up and therefore its concentration is slowly becoming weaker as time progresses.
The graph plotting the carbon dioxide collected against the elapsed time is a good visual to compare rates of reaction and how they change throughout the experiment. As it is the gradient of the line that represents the rate of the reaction, it can easily be seen how the different concentrations’ reactions contrast; the steeper the line, the faster the reaction is taking place.
The lines become less steep as the concentration of the nitric acid decreases, as predicted earlier. This displays the fact that a higher concentration of acid does produce a faster rate of reaction because if the gradient is steeper then a greater amount of gas has been collected in that particular time space. Although the first three reactions involving the 2M, 1.75M and 1.5M nitric acids are fairly similar in shape, they are still uniform to this series.
A higher concentration of acid produces a faster rate of reaction because of the particle collisions taking place between the nitric acid and calcium carbonate. Because the reactants colliding is what causes the reaction, the rate that the collisions take place is what determines the rate of the reaction. If there are a larger number of nitric acid particles per unit volume then there is a larger probability that collisions will take place between them and the calcium carbonate particles, resulting in more collisions. The reaction produces carbon dioxide- if more collisions are taking place then there are more of the products of the reaction, one of which is carbon dioxide.
The rate of the reaction can be calculated by taking the quantity of carbon dioxide produced and divide it by the time elapsed. I will label 0-40 seconds as the start of the reaction. To calculate rate of reaction at the start of the reaction the total carbon dioxide collected would be divided by 40, to give cm³ sec-1.
Apart from the anomalous result of the 1.75M reaction, the rates follow the expected pattern that as the molarity of the nitric acid decreases, the rate of reaction does. The rate of reaction at the middle of the experiment will now be calculated. The rate of reaction was, again, calculated from a 40 second span of data and the middle point was worked out for each individual reaction as they varied in length.
The rates of reaction all appear to be higher at the middle point of the reaction than at the beginning. This is odd since the rate of reaction should start at its peak and slowly decline as the reaction progresses. The reactants are being used up in the reaction. If nitric acid particles are being used and the water particles remain then the acids concentration slowly weakens, making collisions between them and the calcium carbonate less frequent and therefore it results in a slower rate of reaction. Another factor that is unlikely to have made a noticeable impact on the results is that water is a product of the reaction. As the water is produced it further dilutes the acid, lowering its concentration.
It could be that the carbon dioxide collection is slower at the beginning because a certain amount of pressure needs to be built up before the gas syringe starts to move. The following are the times it took the gas syringe to start to move after the reaction was initiated:
The fact that the reactions involving the weaker acid took longer to start suggests that it is a case of building up enough gas to start the syringe. If there is a set pressure that is needed to move the syringe, then a reaction with a lower rate of reaction would take longer to produce the quantity of gas required. Even after the syringe has started to move, it might need more pressure to move it further than that and reach a point where all additional gas produced is counted by the syringe, which would explain why the rate of reaction is slower at the very start of the experiment.
The rate of reaction at the end each experiment will now be calculated. To do this, the last 40 seconds will be used for the quantity of carbon dioxide.
The results don’t fall into a perfect pattern. Since the reactions involving the highest three molarities are so close in terms of their rates of reaction its not surprising there is slight deviation. However, the rates of reaction for each individual reaction are significantly lower than their corresponding middle point rates. This shows that the reactions are slowing down and is shown on the graph by the lines beginning to curve off.
However, by the end of the gas syringes measuring capabilities, all the reactions, except from the one involving the 0.75M acid, were still producing gas at a steady rate. This shows that the reactions weren’t complete yet. In the case of the reactions involving the more diluted acids, there is a much more prominent curve. This could be because there are less reactants involved so the reaction will finish quicker than the others.
The results of the investigation in some ways displayed my prediction, but the patterns weren’t as clearly defined as they could have ideally been; the data was flawed and there were a large number of anomalous results- the most obvious of these being that the three reactions involving the strongest acids were very similar in their results.
The investigation was carried out over a series of sessions and different equipment was used each time. For the majority of this equipment it shouldn’t have made a large impact. However, a significant change in a gas syringe’s performance, i.e. how easily it moves, could have affected the results considerably. Different batches of chips were also used in different sessions. It could be that a particular batch had a larger concentration of big chips or small chips. Changing the size of the chips would change the overall surface area of the total chips. Surface area affects the rate of reaction as it is changing the number of particles of a solid reactant that can take part in the reaction at a particular time.
Another problem that the investigation had was that the reaction was still in full swing (for the most part) by the time the carbon dioxide collection had surpassed the syringe’s measuring capabilities. What was the rate of reaction at the end of the experiment could have still been the middle point. The correct balance of reactants needs to be achieved in order to get a suitably wide span of results but not to run past the 100cm3 mark on the gas syringe. Either that, or use a larger gas syringe.