Pressure
Increasing the pressure on the reaction between gases will increase the rate of reaction. Increasing the pressure has the effect of reducing the volume of the gas and so the particles move closer together. If the particles are closer together, there will be more collisions.
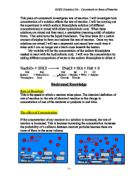
Catalysts
A catalyst is a substance that alters the rate of a chemical reaction without being used up. The mass of the catalyst remains unchanged throughout the reaction.
In order to see what effect the concentration has on the rate of reaction, I will follow this method:
-
Place 50 cm3 of sodium thiosulpahte solution (10g / dm3) in a conical flask
- Add 5cm3 and 2ml/dm3 of hydrochloric acid to the flask and swirl
- Start timing how long it takes for the cross on your piece of paper to disappear. Stop timing as soon as this happens
- Measure the temperature of the reactants with a thermometer before you add the acid and record your results
- Repeat the experiment at different concentrations by diluting the acid with water each time. This is how I will change the concentration. I will use concentration from 5-1 cm3.
For safety precautions I will wear a set of goggles, tie my hair back and I will remember to push all chairs under the table when doing the experiment.
Apparatus:
Equipment
- Thermometer
- 100 cm3 measuring cylinder to measure the thiosulphate
- 10 cm3 measuring cylinder to measure the water
- 10 cm3 measuring cylinder to measure the acid
- Hydrochloric Acid
- Sodium thiosulphate
- Stop Clock
- Pipette
- Beaker
- Paper with a cross marked on it
I predict that the more amount of concentration used will mean the faster rate of reaction. If the concentration is doubled, I think the time taken will be twice as quick because the number of Hydrochloric Acid particles in the same vicinity is double. Therefore, the number of collisions will be doubled. For each of the 5 concentrations of acid, I will consider doing 4 tests. These tests will comprise of repetitions wherever necessary.
There is an equation for the reaction that I am doing. This is as follows:
Sodium thiosulphate + hydrochloric acid = sodium chloride + water + sulphur + sulphur dioxide. This will help with my experiment.
For a fair test, I have to do repeats. I will do the experiment twice and I will observe for consistency. If there are a lot of anomalous results, I will repeat the experiment further more until I am able to find a trend between the rate of reaction and the concentration of thiosulphate solution.. This will also increase the reliability and accuracy of my results.
Before I do my real experiment, I will do a preliminary experiment in order to identify any changes that need to be done for the real experiment. I will record my results in a table as follows:
Preliminary
In order to check if this experiment will work in order to find out whether or not the concentration affects the rate of reaction, I will need to do a preliminary test. This will also help me to decide what evidence to collect and how to collect it. In this, I will do test the first and last concentration as it will take too long to do the whole experiment.
These were the results of my preliminary:
I found out that it took too long for the ‘x’ to disappear at a concentration of 0.4 and if I continued with this concentration, then I would be here forever. Therefore. I decided to change the concentration to 3.5 m. My new results from the trial experiment were as follows:
These results seemed fairly accurate, so I began the experiment. The results helped me finalise my plan because was able to see the differentiation between the concentration and the rate of reaction. The preliminary results corroborated with my prediction.
Analysis And Conclusion
I collected the data from the experiment and produced a table of results. From these results, I found the average and plotted a line graph of the averages in order to see a trend between the rate of reaction and the amount of concentration of the acid.
I noticed that the repeats were fairly constant, however, there did happen to be one anomalous result. Thus showing that there could be things wrong in the experiment. It was clear to see that as the concentration of the acid increases, so does the rate of reaction. For instance, at 0.8m of acid, the rate of reaction was 0.0128, at 1.6m of acid, which is double 0.8; the rate of reaction is 0.0222. Also, at 0.6 m of acid concentration, the rate of reaction was0.0116 and at double the amount of concentration, 1.2 m, the rate of reaction was almost double, 0.0200. Not only can we see an increase in the rate of reaction as the amount of concentration increases, but also it is almost doubling.
I drew a line of best fit on my graph in order to analyse the graph quantatively and came to the conclusion that as the concentration of hydrochloric acid doubles, the rate of reaction almost does too. These were my results:
The rate or reaction doubles when the concentration of the acid does, because if I were to increase the concentration of hydrochloric acid, it would lead to a greater number of acid particles in the same vicinity. This in turn, suggests that the Sodium thiosulphate is being collided with more regularly and so the Sodium thiosulphate will disappear more rapidly, causing the rate of reaction to rise. However, the time taken for the rate of reaction to take place is entirely up to the amount of concentration of Hydrochloric Acid that is being used. If I double the concentration of the acid, the number of particles reacting with the Sodium thiosulphate will also double.
The analysis from my graph fits my prediction, as I mentioned that I thought that as the concentration increased, so would the rate of reaction. Therefore, it is clear to see that my results support my prediction and the graph was very similar to the one I predicted.
Evaluation
I believe that a successful method helped in obtaining these results. I feel that my method showed how to set up the experiment in a thoughtful way with a step-by-step guide of all the apparatus and how to connect the apparatus together. Although there was little room for error in this experiment, I still believed that I handled it well. The apparatus that was used was of sufficient quality and it was the right apparatus needed for this experiment. My method discussed the safety procedures, which was crucial because the experiment consisted of using harmful acid. However, it was sometimes hard to measure out the precise concentration of hydrochloric acid, especially when there was such little amount, for instance 0.6 cm. When doing my preliminary, I experienced a problem; with the 0.4 concentrations, the time take for the ‘x’ to disappear was too long and too time-consuming. I overcame this by changing the amount of concentration.
I think the quality of my results were quite good. When observing the graph, I can see that most of the points were close to the line and in the graph showing the average time taken for the ‘x’ to disappear, all the points were on the curve. This shows that my results were accurate. However, there did happen to be one anomalous result on the graph, showing that there may me imprecise results. It was an anomalous result because it was too slow and should have been approximately another 3 seconds faster. We may not have done the experiment for this reading as accurately and therefore we received an anomalous result.
The temperature of the acid solution affects the experiment. This is because if I were to increase the temperature, the particles of Hydrochloric Acid will move rapidly as they have more energy. Due to the particles of acid moving around extremely quickly, the acid particles will collide with the Sodium thiosulphate more frequently. Particles can also move slower and this cause the temperature of the reaction to decrease in quickness. We ensured that the temperature of the solution was kept exactly the same (at 23 o), therefore the temperature did not affect the experiment.
I think that my evidence collected is valid, simply because it fits my prediction. Most of the points are not far from the line of best fit, and there is only one anomalous result. My investigation was fair because I kept all the other variables (temperature and surface area) the same throughout the experiment. I followed my method, which was extremely clear and precise. The results are reliable and I do have enough results. However, if I were to improve my procedure, I would do more repeats to get rid of my anomalous result. I would use more concentrations so I would get a definite link between the concentration of the hydrochloric acid and the rate of reaction. I would plot more points on the graph and in order to increase the accuracy, I would use a graduated glass pipette. This is a better pipette than the one I used in the experiment, and would make the results more accurate and fit the line of best fit perfectly. This would help me obtain more evidence, which would support my conclusion.
Further experiments I would do in order to provide additional evidence about the effect of changing the concentration would be to use nitric acid instead of hydrochloric acid to see if the results are the same. By changing nitric acid, it doesn’t change much as there is the same amount of particles. It would only help with more evidence to fit my prediction.
The equation for this experiment would be:
Sodium thiosulphate+ nitric acid = sodium nitrate + water + sulphur dioxide.
I would use this method in order to see what the effect of concentration was:
1. Place 50 cm3 of sodium thiosulpahte solution (10g / dm3) in a conical flask
- Add 5cm3 and 2ml/dm3 of nitric acid to the flask and swirl
- Start timing how long it takes for the cross on your piece of paper to disappear. Stop timing as soon as this happens
- Measure the temperature of the reactants with a thermometer before you add the acid and record your results
- Repeat the experiment at different concentrations by diluting the acid with water each time. This is how I will change the concentration. I will use concentration from 5-1 cm3.
If I still wanted to change the experiment a bit more, I would use different concentrations, with a wider range and I would use more in order to be able to plot more results onto the graph. The concentration range may range from 6-0.2. However, I would need more time for this experiment because I am doing more concentrations.