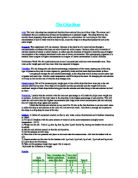
Diagram of the set-up
Specimen tubes
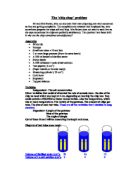
The diagrams shows when the potato cylinders have been placed in the specimen tubes, each one with different amounts of salt solution and water.
Prediction
- My prediction is that in specimen tube A, the potato cylinders will swell up because there is more water concentration in the specimen tubes than there is in the potato cylinder and osmosis will occur. The mass will increase and maybe even the length of the cylinder will increase or even might stay the same. They will turn out hard and thick.
- The cylinders in tube B will increase in mass but not as much as tube A because there is less concentration of water in the tube than in A. The length will not change that much and I predict that it might just stay the same but will swell up. They will become quite hard.
- The potato cylinders in tube C will remain the same. This is because the concentration of water and the concentration of salt both balance each other out and so therefore there will be no change in mass nor length. The potato cylinders will be floppy because there will be a lack in Osmosis
- The potato cylinders in tube D will decrease in mass and length. This is because there is more concentration of salt solution than there is the concentration of water. There will be more water in the 2 cylinders and therefore osmosis will be occurring from the higher concentration of water (which is in the potato cylinders) to the lower concentration of water (which is the solution in the specimen tube). The 2 potato cylinders will become floppy/bendy.
- The potato cylinders in tube E will decrease in mass and length. This is because there will be no concentration in the specimen tube itself and therefore water will be going from the potato cylinders to the 100% sugar concentration. The cylinders will turn out very floppy because most of the water particles have left the potato cylinders and into the outside solution which means it will lack turgidness.
Obtaining evidence
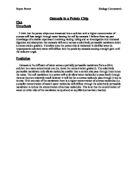
Results table
I had recorded this table during the time of the experiment. It shows when all 10 cylinders have been placed in the different concentrations of salt and taken out; what the original and after length and mass of potato cylinders where and the changes in mass and length; and the final description of the cylinders about what they look and feel like. I will be analyzing it in my analysis and picking at the points that don’t go with the trend.
Graph A
This graph is the outcome of my 10 cylinders. It shows what happens as the concentration of salt increases compared with the change in mass (if any). There is a best line of fit which illustrates the average pattern of the change. The y axis represents the loss or gain in mass in (g) and the x axis represents the salt concentration in (%).
Graph B
This graph is a very similar experiment to the one I have done. It is the same experiment apart from the fact that it has used only 6 cylinder instead of my 10. It helps as a comparisment between my graph and that and I will be explaining that in my analysis of the evidence I have.
Analysing and
Considering evidence
Results table
The results table shows that the changes in length and mass decrease as the test tubes go from 1A-5A and 1B-5B. In 1A, the original length was 50mm and remained the same as the after length. The trend started in specimen tube 1B where the original length was 50mm and the after length dropped by 1mm. This trend of change in mass kept decreasing even further such as in specimen tube 5A where the original length was 50mm and the after length was 46mm which meant that there was a 4mm decrease.
Analysing the mass was not as accurate as it would be expected. The original masses were not all the same and this effected the end results. They were near enough , on average, weighing at around 5 grams but they all varied between 4.75g and 5.02g. the changes in mass went in a nice trend until specimen tube 4A where the decrease in mass is less than the decrease of the potato cylinder in specimen tube 3A. This change of trend also occurs in the repeated experiment in specimen tube 5B where the previous specimen tube had a greater decrease in mass of -1.08g whereas this cylinder had a decrease in mass of –0.98g.
But the description of each potato cylinder does backs up the idea that the more salt concentration there is, the more floppy the potato cylinder will be. The trends from 1A+B – 5A+B is that it should go from being hard and rigid to soft and floppy.
Graph A
The graph shows that as the concentration of salt solution increases, the mass of the potato cylinder will decrease. The 2 experiments (the original and the repeated) are very similar in their positions on the graph. This can be shown be the 2 ‘Lines of best fits’ for each experiment. Even though the original experiment starts at an increase mass of 0.7g and the repeated experiment starts at an increase mass of 0.45g, they both eventually decrease to at around –0.99g. The original experiment graph line shows the right trend of movement but the repeated graph line moves out of trend at the 4th point where the line increases upwards instead of staying in trend and decreasing even further.
Graph B
Graph B has been taken from a preliminary experiment. The trend of the experiment is done well showing the trend of the pattern decreasing at each stage. The line of best fit fits well with the graph showing a good average decrease in mass as the concentration of salt solution increases. Both the increase masses and the decrease masses don’t quite correspond to each other as a graph line. The graph shows a rapid decrease of mass going down 2g in less than 0.25% concentration of salt solution. This trend changes at point B where the decrease in mass slows down to under a gram in over 1.0% concentration of salt solution. Then the rate of decrease in mass becomes more rapid and goes from no change in mass to –2.5g in 1.5% concentration of salt solution.
The Comparisment
In comparisment with graph A, the change in masses are not as steep to start off with. The trend decreases very steadily until point D where there is a very steep decrease in mass to point E whilst the steep decrease in mass in graph B begins at the second point with a decreasing mass of 0.25g. The 2 are very similar coming towards the last points. Both have a slow/steady decrease in mass after having a big decrease 2/3 of the way. The actually starting points of the masses are very different with Graph A starting with an increase mass of 0.7g and then increase mass in graph B is 3g and the last results of both are far off each other.
Background knowledge
Of Osmosis
Osmosis is the movement of water molecules from a higher concentration of water molecules to a lower concentration of water molecules through a partially permeable membrane.
This can be seen in living cells. The cell membrane in cells is semi-permeable and the vacuole contains a sugar/salt solution. So when a cell is placed in distilled water (high water concentration) water will move across the semi-permeable membrane into the cell (lower water concentration) by osmosis, making the cell swell. This cell is now referred to as turgid. If done with potato cells the cells would increase in length volume and mass because of the extra water.
If these potato cells were placed in a solution with a low water concentration, then the opposite would happen. Water would move out of the cell into the solution. In extreme cases the cell membrane breaks away from the cell wall and the cell is referred to as plasmolysed. The potato cells will have decreased in length, volume and mass. The greater the concentration of water in the external solution the greater the amount of water that enters the cell by osmosis. The smaller the concentration of water in the external solution the greater the amount of water that leaves the cell.
However, there will be a point where the concentrations of water inside and outside the potato cells are equal. At this point there will be no change in the length, volume and mass of the potato, as the net movement of water will be zero, no osmosis has occurred.
Conclusion
The final conclusion of this experiment is that if more water is used in Mr. and Mrs. Brown’s chips, they will become hard. If They use more salt concentration in the chips than water concentration then their chips will become bendy and soft. Their original problem is that they receive complaints from local costumers that the chips are too soft and limp. Now if my theory is correct and is well backed up, they just require to put either more water concentration in the container or put less salt concentration in the container. At concentrations above 0.75 M, there appears to be no further water loss, suggesting that the cell is fully plasmolysed.
From the graph an estimate to the concentration of the potato cell can be made as 0.25M. As this is the point where the potato is not increasing or decreasing in mass. However, it is important to realize that this is only an estimate as the potato cells will not be uniform in their concentration.
My prediction was the same as my conclusion. The specimen tubes with the higher concentration of salt solution would have the harder potato cylinders and the specimen tubes with the higher concentration of salt solution would have soft and floppy potato cylinders. Going back to my evidence and results, I can prove this theory right and to back it up. And to back it up even more, I checked certain biological books to prove my theory right.
Evaluation
The repeat and the original
The repeat and the original experiments both gave the same idea to the knowledge that the potato cylinders would become harder if there was more water concentration than the concentration of the salt solution. They both gave the same trend of patterns of the gain/loss in mass, even though there was an anomaly in the results table and the graph A. This is where the 75% concentration of salt solution had a higher loss in mass (-1.08g) over the 100% concentration of salt solution (-0.98). both had almost identical ‘after lengths’ and that can be shown on the results table.
Anomalies
There was an anomaly in the results table where the potato cylinders in specimen tubes 2A and 3A where they both had the same change in length (-1mm); same/very similar original masses but the ‘after mass’ was very different (0.25g,-0.96g). But if it could be explained by the greater % concentration of salt solution, then that would mean that the ‘after lengths’ should have been slightly different.
Improvements in the
Experiment
There were a number of ways in which the experiment could have been done more accurately:
- The concentrations could have been made more accurate using titration instead of a measuring cylinder
- When the potato was dried to remove surface liquid, it was not necessarily done the same with each potato cylinder/ the time spent on each of them being dried up
- The cutting of on the edges to make them 90 degrees perpendicular could not have been as accurate as it should of
- Measuring the cylinders with a normal ruler was not a very accurate choice in that the cutting would of not of been precise
- The timing of putting each cylinder in the specimen tube and taking them out might not of been as accurate as it should of
- Could of left the potato cylinders for longer
Reliability of the
Evidence
The reliability of the evidence used was very reliable indeed. I had gone over 2 different books and 1 internet site which all posed the same idea of how Osmosis would occur in the different concentrations of water and salt solutions. I was very happy to see that each one backed me up on every point. The evidence was very sufficient in the idea of how I got some anomalies in the results and enabled me to figure them out.
Further work could be carried out to include concentrations that increased in 0.1 M rather than 0.2. This would increase the accuracy and improve the graph. Other investigations could include using different varieties of potato or different plant tissues.
I predict that for the chip placed in pure water, since there will be a higher concentration of water molecules in the external solution than in the chip, the water molecules move via osmosis from the solution into the chip’s cells through the semi-permeable membrane. With the increased volume of water inside the chip’s cells they become hard and turgid increasing the mass and length of the cells
and therefore the chip as well. With the salt solutions there will be a higher concentration of water molecules in the chips’ cells than in the external salt solution. Therefore I predict that water molecules would diffuse out of the chips’ cells through the semi-permeable membrane into the external salt solution, until the equilibrium is reached. This would make the cells flaccid and in the
100% salt solution the cells could be plasmolysed due to a large amount of water molecules diffusing out of the cells. The mass and length decrease will get greater as the salt solution increases because when the cell become flaccid they shrivel reducing in size.
Jus Dooooooooooooooooooooooooooooozzzzit, iiiiiiiiiiiiiiiiiiiiiiiinnnnnnnnniiiiiiiiiiittttttt,Bobby Hu...Diiiiiiced(finga in ear)