I experimented with the mass of the chips and finally decided on a total mass of 3.4g. However, some of my unrecorded results showed inconsistency suggesting that a key variable was not being kept constant. I discovered that this variable was the surface area of the chips. Though the marble had totalled to 3.4g, on each occasion the chips had different sizes and quantities. Therefore I decided to use four evenly sized marble chips (totally 3.4g) for my actual investigation- minimising the affect of this variable.
I also looked at the concentration of the Hydrochloric acid. I decided that the solution would total 40ml and the range would be based upon the concentration molar. As the most concentrated acid was 2 moles I used this as one of the two extremes. I decided not to do 0 moles as the other extreme, based upon background knowledge on reactants I know that water alone will not produce any CO2 when mixed with marble. Therefore I chose 1 mole as my other extreme. I calculated how much Hydrochloric acid and water this was in terms of (40ml) and applied it to my trial experiment:
These results show that when the acid was at 2 moles, more CO2 was produced than what the 75ml cylinder could hold, therefore instead of lengthening the time span of each experiment I increased the volume of the measuring cylinder to 125ml. Here were the results:
Initially I chose to investigate every 0.5 mole solution (i.e. I would investigate using the solutions of (1, 1.5, 2 moles). However, in order to make a more in-depth and detailed analysis of the results, I needed to further my investigation, so I chose to use solutions for every 0.25 moles and extended my range so that it went from 0.25 to 2 moles rather than 1 to 2.
Key Variables:
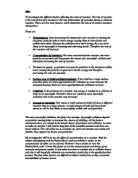
The variables that may have an affect on this experiment are:
Size of marble chip- the size of the marble chip will affect this experiment because this dictates the surface area. The larger the surface area the more marble will be in contact with the hydrochloric acid and able to react.
Concentration of hydrochloric acid- this is the proportion of hydrochloric acid in the solution.
Volume of acid- this will be the amount of hydrochloric acid that will be reacted with the marble chips.
Catalysts- by weakening bonds these increase the rate of reaction by lowering activation energy a catalyst will not be used in this reaction, however.
Mass of marble chips- The mass of the marble chips is a way of measuring the quantity of chips being used.
Temperature- the temperature adds energy to the reaction and affects how quickly the particles move. By doing this temperature affects the number of affective collisions
Light intensity- the light intensity has a very small affect on the experiment so it will not be measured in this experiment.
Apparatus:
I have decide to use the following equipment to conduct the experiment:
- Plastic tub
- Stand
- Clamp
- Boss
- Rubber Bung
- 100cm³ Conical flask
- Delivery tube
- Stopwatch
- 125ml measuring cylinder
- 75ml measuring cylinder (x2)
- Evenly sized collection of broken marble
- Electronic-weights
Diagram of apparatus set-up:
Method:
Firstly, I will have to set-up the equipment before the experiment can take place. I will attach the delivery tube to the conical flask. I will then set-up the stand and attach the clamp to it using a boss. 16 separate portions of marble will be put aside- each containing four similarly sized pieces totally 3.4g. The plastic tub will be filled with water, with the 175ml cylinder partially in the water- attached to the clamp and stand. This cylinder will be upside and filled with water so I can measure the intake of CO2. The cylinder will have the delivery tube hooked underneath it to prevent the CO2 from escaping into the water. After this is complete, I will begin the experiment by measuring 40ml of HCl. A marble portion will be placed inside the test tube and when the HCl is poured in, the rubber bung must be placed immediately over the top and the stopwatch begun. The test will last 2 minutes after which, I will take the readings of the amount of CO2 produced. When complete, the conical flask and delivery tube must be washed thoroughly to ensure a fair experiment. I will then begin the second test by measuring 35ml of HCl and 5ml of water. I will place another portion of marble into the test tube and pour the H2O first followed by the HCl. I will repeat then repeat the steps from above. I will conduct the test 16 times in total (twice over to gain more accurate results). I will use the solutions of:
HCl (ml)/ H2O (ml)
- 0
- 5
- 10
- 15
- 20
- 25
- 30
5 35
Hypothesis:
The more concentrated the acid then the quicker the reaction will take place, because there will be more HCl particles than water particles for the marble chips to collide with and therefore react. More collisions between the two reactants (HCl and CaCO ) will take place resulting in a quicker time for the reaction.
Prediction:
I predict that the higher the concentration the faster the reaction will take place this is because in a higher concentration there will more hydrochloric acid molecules per set volume. This means that there will be a higher chance of the calcium carbonate molecules colliding with the hydrochloric acid and reacting. This should in theory increase the rate of reaction as the concentration is increased. Therefore more CO2 is produced.
OBTAINING EVIDENCE:
Results:
While working all safety procedures were followed very carefully like the use of safety goggles and putting the bags under the table. The measurements I feel were fairly accurate as the results were what I expected. There was one anomalous result, however, which was repeated to get a more accurate result. I repeated the experiment twice so I could find averages and get more accurate results. The results were measured to the nearest centimetre cubed because this was the maximum accuracy of the cylinders.
ANYALSING AND CONSIDERING EVIDENCE:
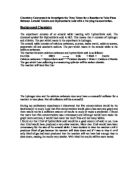
Overleaf is a hand-drawn graph comparing the concentration molar and the average CO2 produced
The results that were found were what was expected to a certain degree. The fact that the reaction rate was highest at the highest concentrations shows that the higher the concentration the more particles are present per set volume therefore more CO2 was produced. However this did not apply in one instance, when the concentration molar was 1.5 and it produced 74ml of CO2, whereas the previous test with 1.25 moles produced 93ml of CO2. This is evidently shown in the average graph’s free-hand line. Though the line of best fit still reflects a positive correlation. The inconsistency of the results prove that activation energy does not play a part because if this did the gradient of the free-hand line would not increase by the amounts it did. This is due to the fact more/less energy would be needed to start the reaction and there would be a higher or lower gradient of the line so the gradients would not go up /down by the same amounts.
The results still back up the collision theory as they show that particles must collide with each other with enough force to break any bolds holding the reactants together. They did this as CO2 was produced.
Evaluation
The results from the experiment showed a pattern but the prediction that was made was not completely supported There was one anomaly, however, but this test was repeated to give results that matched the pattern. It is not certain why this result was found but it was probably due to the mass of the marble chips being measured slightly inaccurately because we measured the mass of the chips to the nearest 1/10 of a number- this would account for a slight margin of error. Another possibility is because the surface was different for each chip the total surface area was different i.e the smaller the surface area, the less marble will be in contact with the HCl acid and able to react. This would explain the anomaly in the first test at 1.5 moles.
The actual measurements were accurate to about cm³ because this how often the cylinders were marked, therefore it is unlikely that I misread the reading.
The method did show the relationship between the concentration and the rate of reaction but there was a slight margin of error because when turning the cylinder upside down a small volume of water was lost. To solve this problem I could have used a gas syringe but the problem with this is that I wouldn’t be able to test the higher volumes of gas, which would mean the range of results would be lower which in turn would make the pattern I got less obvious.
The experiments were fair tests to a certain extent but there was a certain margin of error because the results recorded were only to the nearest cm³ and the values of the controlled variables were not exact amounts so the may have been slightly differently each time which would have affected slightly the reliability of the results. For instance, the temperature of the water could have varied- so if the water was warm then there would be more energy for the particles as they would vibrate faster which could lead to a faster reaction rate.
To find if the prediction was entirely supported or even if the reaction rate slowed down after a certain time, the experiment could be timed for longer than two minutes or I could have extended the experiment so that concentration molar would be beyond 2 moles. However, such a test would be very dangerous as HCl at this molar level is highly reactive. The test would enable me to find whether the pattern changed after a certain time or the reaction rate just generally slowed down. It is not certain if the concentration keeps increasing the rate of reaction or this only happens to a certain extent.