Experiment 1:
0cm3 H2O
5cm3 HCl
25cm3 Na2S2O3
Experiment 2:
1cm3 H2O
4cm3 HCl
25cm3 Na2S2O3
Experiment 3:
2cm3 H2O
3cm3 HCl
25cm3 Na2S2O3
Experiment 4:
3cm3 H2O
2cm3 HCl
25cm3 Na2S2O3
Experiment 5:
4cm3 H2O
1cm3 HCl
25cm3 Na2S2O3
7. I will repeat the experiment twice in order to get a more accurate result, as an average will be obtained.
Prediction
The faster the reaction takes place, the shorter the time needed for the reaction to finish. To be more precise, the speed of reaction is inversely proportional to the time taken for the reaction to finish. If the acid concentration doubles, the speed doubles. The reason for this is that the ions are closer together in a concentrated solution. The closer together they are, the more often the Sodium Thiosulphate ions and Hydrochloric Acid ions collide. The more often they collide, the more chance they have of reacting.
I, therefore, predict that with the acid concentration decreasing, it will take longer for the cross to disappear.
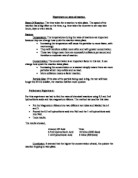
Fair test
To justify my prediction, the following factors need to be controlled to obtain accurate results;
- The person watching the experiment will be the same each time as it is a judgement that only the same person would note.
- I would need to use the same equipment all the time
- I need to keep the pipettes in the right beakers because of they weren’t, I could get a reaction that I do not want and that would mean that one conical flask will have either more or less HCl than required. This would be unfair to the experiment.
- I am changing the concentration, which means the temperature will have to stay the same. If the temperature was to change, the experiment would be unfair. With colder water, the particles move slowly and do not collide very often. If you increased the temperature, the particles would begin to move faster with greater energy. They will collide more often with many more collisions being successful than before. This is because temperature affects the amount of kinetic energy the particles have and therefore the reaction time.
Results
0.05M of Sodium thiosulphate 2M of Hydrochloric acid
60cm3 5cm3
All averages are rounded to nearest whole number
The averages are plotted on graph (1) overleaf
These results are plotted on graph (2) overleaf
Analysis
The faster a reaction takes place, the shorter is the time needed for the reaction to finish. This is true with my results, as with the highest concentration of Hydrochloric Acid present, the time taken for it to react was greater than any other concentration of HCl.
Looking at graph (1), I can see only one anomalous result. This is the reaction between 10cm3 Thiosulphate and 50cm3 water. The average time taken resulted in 1169 seconds. This seems unlikely as with 15cm3 Thiosulphate and 45cm3 water, the average time taken is 622 seconds. Possible reasons for the anomalous results could have been down to either poor observation skills, or not rinsing the conical flask out properly. There could have been more water in there than anticipated, therefore making the solution less concentrated than it should have been. The 622 seconds result fits in well with the other results and forms a pattern of a smooth gradual decline curve on the graph. The anomalous result makes the graph flatten out at the bottom of the curve. When drawing the line of best fit, I did not include the anomalous result. The graph does show the trend that when the volume of thiosulphate is decreased the time taken decreases also.
Looking alternatively to graph (2), there does not seem to be any anomalous results. The points join up to make a smooth upwards curve on the graph. The line of best fit is placed between all of the points, this works well as there are an equal amount of points on either side, with them all spread fairly evenly along the curved line. This links in very well with my prediction that with a higher concentration, the rate of reaction is faster.
Evaluation
My method worked well because I was able to get a set of results at the end. However, there were a few problems. On graph (1) there was an anomalous result, and because we did the experiment over two days, we could not use the same apparatus as the day before. The stopwatch however was the same, so we were able to get as accurate results as the previous day. Graph (2) does not show any anomalies.
Graph (1) shows a point that doesn’t fit the pattern, as does the second point of graph (2). Even though the graph does join up fairly smoothly, the point is slightly out. This point has been circled on the graph.
To make sure there are no anomalous results next time, you will need to follow the method and equipment list fully, and make sure the flask and beakers are cleaned out and dried before a new experiment is taken out.
If done again, I would change the temperature rather than the acid concentration. When sodium thiosulphate and Hydrochloric acid are reacted together, Sulphur is formed. The temperature increase would make the Sulphur form faster. The ions would have more kinetic energy so would collide more often and more vigorously and so there is a greater chance that they will react.