These results sow that the side, which retains the most heat radiation energy, is the shiny white side and then the shiny black and then the matt black. This is why we will be using a shiny white polystyrene cup for the actual and preliminary work.
Factors which affect different types of heat flow are, with radiation and conduction the type of material it is trying to transfer its heat energy to. This is because they all have different atom arrangements which affects how well they are able to conduct heat energy, e.g. Metal conduct heat better than stone does. Convection can be affected by what types of material it is convecting through .e.g. Oil would convect differently with water. Different gases would also be differenyt and affect the rate of convection.
To help make the table clearer and to finalise the actual test I decided to do some preliminary testing which would help me to understand things like if the cup I am using would work better with or without a lid.
Equipment used
Polstyrene cup,thermometer, card board lid ( second test only ),kettle , stop watch and measuring cylinder.
I measured out 100cm cubed of water , made sure that the thermometer was at the correct temperature therefore making sure that the water was. I used a polystyrene cup with out a lid on in my first test and with a lid on in my second, this was to see if I would get better results with or without it. These are the rwaults which I gained.
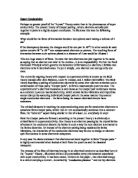
Heat energy lost Heat energy lost
From this chart you can see that without the cardboard lid the results atre very random and this means that the heat is able to fluctuate greatly as you can tell from my results. I have therefore decided to have a lid on the cup as the results with the lid on seem a lot more constant and the heat isn’t allowed to fluctuate as much.
I suspect that I will find that heat energy will be lost mostly conductivity and convection rather than radiation as I have tried to reduce the effects of this to as little as possible . For my acual test I will change the integers at which heat is lost from e.g. instead of going 70 degrees and above to 50 degrees and above I will try to have exactly 70 degrees and exactly 65degrees, I will then be able to draw more accurate results from this.
Plan
Equipment needed
. Polystyrene cup . Kettle
. Thermometer . Stop watch
. Cardboard lid . Measuring cylinder
How to set up the experiment
The experiment will be carried out in the following way:
- Set apparatus uo as shown above.
- Tap water will be put into a kettle to boil
- It will then be put into a 100ml measuring cylinder to measure the amount of water
- Pour water into a polystyrene cup, put lid on and take the temperature
- Wait until the water gets to 70 degrees or anyt of the other integers , do this by looking on your thermometer.
- When it hits the wanted integer time 2 minutes on your stop watch and after this take down the temperature at the end of the two minutes.
- Take more boiling water repeat the process until the experiment is finished.
- When the experiment is finished repeat the whole process again to get another set of results to make the average and the results will therefore be more accurate.
- Tabulate your results.
I made this experiment as fair as possible by keeping the same cup each time. This is because the cups wall thickness might be different on other cups and thus they would either conduct more or less energy away from the water that I am using. Secondly l will need to keep the same thermometer in order to keep inconsistencies the same. The experiment will also need to be accurate and in order to do this I will need to do the following. Firstly I will need to keep the hole in the cup lid as small as possible in order to keep the heat from escaping. Secondly I will have to make sure that the lid is not removed during the experiment. Finally I will need to make sure that the cup I am using has no other holes in oit otherwise water could leak out, but it could also loose heat energy more quckly than a notrmal cup.
It should look like this.
Results
This table shows my results after doing tests twice the same way as mentioned in the pages before.
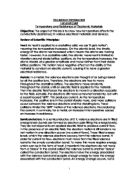
Graph attached
Conclusion
The input value, which gave me the highest temperature loss, was when it was at 70 degrees and the one, which gave me the lowest results, was 30 degrees. I think that this is because the greater the difference between the internal and the external temperature the faster the heat will be lost. This statement is shown in my results because the more my results fall the smaller the amount of heat lost.
This shows that my results were fairly constant and shows that my experiment was fair and therefore was a success.
Evaluation
As all of the pairs of my results were close I know that my experiment gave reproducible results. This shows that my experiment was a success and that my results were of a good quality. I do not believe I have any anomonlous results which shows to me that again my experiment was accurate. My line of best shape goes through all the results , this tells me that I have high quality results and a good experiment.
I could improve my experiment if I was to do it again by using more viscous liquids which could give me an insight into how heat is lost in other liquids. I could also alternate the environment in which it is done in to see how it is effected by external as well as internal heat.
As an extension to this experiment I could use DL + as an electronic temperature measurment device would be more accurate. This would also be good because it can be set to take temperatures hundreds of times per second. This would give me a better curve of temperature vs time and would also allow a finer discrimibnation to take place. Another way in which I could extend the experiment could be to do it oppositly and determine how much energy is needed to maintain the temperature. To achieve this I would need new equipment such as electronics heating , a thermostadt and a joule meter. I could also work out the energy by doing the calculation below.