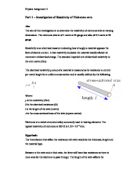
If the length of the wire is increased then the resistance will also increase as the electrons will have a longer distance to travel and so more collisions will occur. Due to this, the length increase should be proportional to the resistance increase.
Temperature also has an affect on the experiment as the voltage affects the temperature. The more the temperature increases the more the particles vibrate leading to a reduction in the output voltage. Although this is not by a huge amount, this does have an affect. If the wire is heated up the atoms in the wire will start to vibrate because of the increase in energy. This causes more collisions between the electrons and the atoms as the atoms are moving into the path of the electrons. This increase in collisions means that there will be an increase in resistance.
An increase in resistance will lead to an increase in resistivity.
Conclusion from results
The following conclusions can be drawn from my results: -
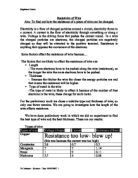
- The resistance is proportional to the length of the wire. This is known because a straight-line graph is achieved. This was expected in accordance with the theory of resistivity. A straight line is produced since metals are ohmic devices.
- As the voltage, doubles the resistance also doubles. This is because as the voltage increases (doubles) so does the number of collisions between the electrons and atoms inside the wire and hence the resistance increases (doubles).
-
The resistivity value of nichrome wire that I found is 108.7 *10 –8 ± 6.3*10 –8 Ωm
Evaluation
The experiment was found to be relatively safe. The only hazard was if a current in excess of 0.50A was used, as the wire would over heat and the pupil could possibly suffer from burns. I avoided this type of accident by keeping the current at 0.45A, I did not use 0.50A because there is a risk of a current in excess of 0.50A flowing through the circuit when trying to gain 0.50A exactly, I did not want to take this risk.
If I was going to repeat the experiment myself or if other pupils were to do this experiment I would recommend that the current is kept reasonably below 0.50A, perhaps between 0.40 A and 0.45A. I would also recommend taking more than two voltage readings at each length. This will produce a more accurate average voltage and so increase the accuracy of the resistance and resistivity results.
There was sufficient time to do the experiment. So much so that I was able to take to readings at nineteen different lengths.
The results of the experiment were found to be accurate as the value for the resistivity of nichrome wire in my book was said to be 100 * 10–8 Ωm. Since my result was within 6 *10–8 Ωm this makes my experiment reasonably reliable. Laboratory conditions should be taken into account, the value in the book was likely to have been from an experiment, which was more precise than mine was, also the book value is accurate at 25 ºC. The room temperature of the lab was not recorded in my experiment although I expect that it was lower than 25 ºC. Other affecting factors are mentioned below.
No anomalous results were present. This confirms that the experiment was accurate. It also indicates that the equipment used was to the correct accuracy for the experiment and that the errors were of satisfactory size. However, the graph does not go through the origin, I expect that this is due to the systematic error in some of the equipment used. (- 0.01mm in micrometer and 0.001m in ruler)
The experiment could easily be reproduced.
Factors which could affect the result
The following factors were recognised as being required to be constant for the experiment to be 100% reliable: -
- The pressure applied to the jockey- this is not easy to control as the length of the connecting wires effects the angle at which contact can be made between the jockey and wire.
- The current sent through the wire- this is relatively simple to control by varying the voltage supplied.
- The rounding of decimal numbers- throughout the experiment I rounded numbers below 0.5 down and number above and including 0.5 up. This was to keep the results consistent.
- The tension in the wire- if the tension is altered on the experiment this will effect the readings for the length.
- The temperature in the room- this can affect the resistivity of the wire. The temperature can be kept constant by not opening a window or door midway through the experiment.
Sources of error
As well as the affecting factors, there were some errors in the experiment that arose and may have affected the overall results.
The main error found was the condition of the ruler. The ruler I was provided with was chipped and so the scale started at 1mm and finished at 996mm. Due to this I could not take readings up to the 1m mark as I had initially planned to. This error could be solved by using a steel rule as they do not chip as easily and so the scale can be used from 1mm up to 1m.
Another error found was the condition of the wire. The wire I was provided with had many kinks, most likely because it had been wound in a coil. This will have affected the readings for current, because the current will not have flown through a kink as easily as a straight piece of wire. The voltage may have been affected too. This problem could be solved by using wire that had not been wound in a coil or thicker wire, as it would be less malleable.
Another problem that I identified was keeping the wire straight. This was due to the kinks. The main problem area was round the middle of the area. I attempted to solve this problem by using cellotape to secure the wire to the ruler in the middle. Although this was effective, it too may have affected the results. A more successful way to secure the wire would be to perhaps use clips; they should lightly hold the wire in place without exerting a force of pressure on the wire, as that would affect the results. Therefore, a more successful way would be to use pointers instead of crocodile clips. This is because the pointers would be more accurate because the tips have a much smaller area than the crocodile clips giving a more accurate measurement of the length of wire.
As well as making the above modifications, I would also improve my experiment by testing different widths of the nichrome wire. I would do this to expand on my experiment to see how width affected the resistance and resistivity.
AS Physics Coursework- Determination of the resistivity of nichrome wire.