In solutions of 0.8M and 1M the decrease in mass will be extremely noticeable as the concentration gradients of both the solutions and the potato are dramatically different. There is a small chance (because we are dealing with high molars of sucrose solution) that the potato cells may become flaccid (lacking in strength or firmness) and the cell contents may shrink and detach from the cell wall, becoming plasmolysed.
All in all, I predict that a decrease in mass of the potato will begin to show from the 0.4M solution onwards. This is due to the fact that there is a hypertonic concentration in all concentrations from this point and above. I have also predicted that there will only be an increase in distilled water as the solution surrounding the concentration will be hypotonic. I think that the Isotonic Point, if there is one will be found in the 0.2M solution as the concentration gradients are so simillar. In the case of the 0.8-1M solutions, as the potato may have become flaccid there is a chance that the potato will reach a point where it will not be able to lose any more water.
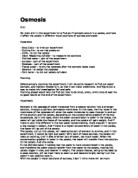
Isotonic, Hypotonic, Hypertonic, Explained:
Hypertonic and Hypotonic Solutions, in terms of osmosis:
Osmosis: Movement of water molecules (blue circles) through a semi permeable membrane (red line) from a region of high concentration (inside cell) to a region of lower concentration (outside cell). Inside the cell the solution is hypotonic with a low solute (sucrose) concentration. Outside the membrane the solution is hypertonic with a high solute (hydrated sugar molecules) concentration shown by the orange circles. The membrane is not permeable to the hydrated sugar molecules as they are too large. Since the concentration of water molecules per unit area is higher inside the cell than outside, water moves out of the cell.
N.B: Osmosis is a form of PASSIVE TRANSPORT - that is, no energy is required for the molecules to move into or out of the cell.
Method:
In order to conduct this investigation one has to undertake the following steps:
1. Cut several cylinders from a potato, each of the same length and relative mass (approx.). In order to do this one should use a cork borer so each cylinder is of the same dimensions, though it involves a lot of meticulous slicing of the cylinders in order to make sure that each cylinder is of relative mass.
2. Place 2 cylinders in each petri dish, ensuring a method of fair testing and to detect any anomalies.
3. Prepare sugar/water solutions of various molarities (In my case 0.2M, 0.4M, 0.6M, 0.8M and 1M). Using the formula M2 V2
M1
4. After preparing solutions ill each of the 5 petri dishes with different molarities of sugar. Use one other petri dish filled with distilled water as the control, so one could later make comparisons as to how different molarities of the sucrose solution affect osmosis.
5. Leave the petri dishes for approximately 24 hours.
6. After 24 hours has passed, remove the cylinders from their dishes using tongs, wiping off any excess solution using a paper towel (and being careful not to squeeze or damage the cylinders).
7. Now statistics can be collected in order to draw a conclusion. Weigh each cylinder and determine the weight gain or weight loss. From these statistics one can determine percentage increases/decreases and use averages to draw conclusions about the correlation of their results etc.
The Formula, Explained:
Here is an example as to how the formula could be used when preparing different molarities of sugar/water solution.
Total vol.= 40 cm³
0.2M = Concentration Required
from 1.0M = Stock solvent
V1 = 0.2 X 40 cm³
1.0M
= 8 cm³ of sucrose solution
= 32 cm³ of water to dilute
0M = 40 cm ³ of water
0.2M = 8 cm ³ of water / 32cm ³ of sucrose solution
0.4M = 16 cm ³ of water / 24cm ³ of sucrose solution
0.6M = 24 cm ³ of water / 16cm ³ of sucrose solution
0.8M = 32 cm ³ of water / 8cm ³ of sucrose solution
1.0M = 40cm ³of sucrose solution
Fair test:
In this experiment there should only be two changing variables: 1: Different molarities of sugar solution. 2: Changing weight of the potato samples. To keep these two variables the only variables in the experiment I must:
1: Keep the potato samples the same length (2cm). This is because if one potato sample is 1cm long and one is 3cm long then the 3cm long sample will have a larger surface area and osmosis will take place more quickly. (Though the mass of each potato being equal is essential, so this may prove to be difficult).
2: Use the same potato. This is because using a different potato may affect the experiment. For example the age, species e.g. King Edward, size and any differences in the potato can be kept to a minimum.
3: Stop the evaporation of any of the molar solution. This is because if the sugar solution evaporates past the level of the of the potato then the potato sample will have less surface area in the solution so may osmosise slower. To stop any solution evaporating a foil lid can be placed on top of the test tube.
4: Accurate amount of sugar solution: To make the amount of solution placed in the test tube as accurate as possible a burette/pipette may be used to measure out the exact amount needed.
5: Contamination: As each test tube is filled up with the different molar solutions the burette/pipette which would measure the amount of solution placed in the test tube may become contaminated with different molarities. To stop this the measuring cylinder and burette/pipette must be washed every time they are used.
6: Average: To make the experiment as accurate as possible an average will be taken out of 5 results taken. Also any clearly anomalous results should be ignored and later discussed.
7:Temperature: The temperature may affect the results of the experiment, for example at extreme temperatures the potato cells may die and at less extreme temperatures the experiment may be speeded up. To keep this from happening all the petri dishes will be kept in the same place.
Variables:
- Molarities of the sugar/water solutions
- The weight of each potato sample (after the 24 hour period)
Necessary Equipment:
+Cutting Tile - Surface protection, to be used when using the cork borer to cut cylinders.
+Scalpel - To make any small alterations to the cylinders (e.g if one cylinder is not of relative mass)
+Cork Borer - To cut potato cylinders of accurate dimensions.
+50cl Measuring Cylinder - To accurately measure solutions. (Fair testing)
+Distilled Water - To be used as a control.
+Sucrose Solution- For testing the factors affecting osmosis.
+Potatoes - Our test.
+Paper Towels - To wipe off any excess solution after the 24 hour period.
+Scale - To determine the before/after mass of the potato cylinders.
+Pipette - For transfering the solutions.
Safety Precautions:
+Wear protective eyewear at all times.
+Be extremely careful when handling dangerous apparatus, such as scalpels or cork borers as misuse may cause injury.
+Make sure there are no obstructions, tuck stools in etc.
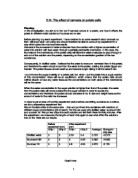
Results:
The charts and graphs on this page show the mass of the potato cylinders after being left in solutions of various molarities for a duration of 24 hours. Each potato cylinder's original mass was 1.22g. The graph above depicts a negative correlation between the concentration (m) and percentage change. We can see from the trend of the graph that the percentage change begins to level out between 0.8M and 1M. This is most likely a result of plasmolysis.
The graph has led me to believe that my prediction, based on my knowledge of isotonic,hypotonic and hypertonic solutions in relation to osmosis and diffusion was correct as the graph directly correlates with my original prediction.
Conclusion
The results reflect on my orginal prediction and my hypothesis. It concludes that plant cells increase in mass when the outside solution is hypotonic (when there are less solute molecules in the surrounding solution, high water potential) and decrease in mass when the outside solution is hypertonic (when there are more solute molecules in the surrounding solution, low water concentration). This change in mass is a result of osmosis (water moving from an area of high concentration to an area of low concentration through a semi permeable membrane). As we can gather from the graph, the change in mass between each molar unit of concentration is large, however, as the molarity of each solution increases the gradient of the graph begins to level out (between 0.6M-1M). This gives reason to believe that between concentrations of 0.8M and 1M plasmolysis is occuring.
From the graph we can also see that the Isotonic point would most likely be located between 0.1M and 0.2M. 0.2M is just a little over 0% increase, so this gives me reason to believe that the isotonic point would be located here. This shows that my original prediction regarding the isotonic point was not too far off. If I wanted to investigate this in the future I would use solutions ranging from 0.1-1M, using distilled water once again as my control.
Evaluation
I found this experiment particularly challenging as it depends soley on accuracy. This meant doing a lot of meticulous, time consuming work in order to obtain fair and reliable results.
- I had set my ideal mass at 1.22g, however it was extremely difficult to get this precisely to the mg, so my results are not completely accurate. However, they are as fair as possible. If I was to do this again I would ensure I could measure each cylinder to a more accurate, yet feesable scale.
- It was hard deciding how much solution could fit into each petri dish, along with the cylinders. Spillage caused me to repeat the experiment several times to ensure accuracy. In the end I ended up cutting each cylinder in half so the lid and the solution could all fit properly with minimum spillage.
- Mass was more important than weight in this experiment, although I had cut all the cylinders to the same length, they varied in mass. Slicing the potato cylinders more in order to ensure they were around the 1.22g margin was extremely time consuming. One could say this procedure was a little ushered, as we had time restrictions which lead to the results not being as accurate as they could be.
- If I could do this experiment again I think I would use molarities with gaps of 0.1M, e.g 0.0M,0.1M,0.2M,0.3M etc. I would also be more inclined to use larger petri dishes to avoid spillage. I would also investigate which parts of the potato had the highest water potential and see if a conclusion could be drawn as to how this may have effected my initial results.
- My results proved to be accurate and showed a strong correlation though I do think that they could be more accurate. I feel that the main factors that would have effected my end results would have been human error as a result of lack of time and resources.
- If I were to extend this investigation further I would use other types of plant cells, such as leaves or other vegetables. I could then extend my results to further validate my conclusion.

![Determine the osmotic properties of a potato and how osmosis within the potato is affected in different concentrations of sucrose and water [molar solutions].](https://mbt-essays-prod-public.s3.eu-west-1.amazonaws.com/54655/listing/54655_1.jpg)