- Evaporation is the process by which particles from a liquid form a vapour. Perfumes are designed to evaporate over a time period of several hours. The appetising smell of cooking food is due to evaporation. Evaporation is important to us when we are in a hot climate. This is because liquids need energy to evaporate, and they take this energy from their surroundings. You can feel the coding effect if you put a drop of a liquid on your skin that evaporates easily.
- Variables to Test / Hypothesis:
- Wool: The more wool around the container the better the insulator it would be; the amount of wool can make a difference in how much the temperature would fall in every one or two minutes, because if you have a bit of wool the heat could slightly go through but when you have enough wool to cover the container the air between the pockets would make it a good insulator.
- Silver: A bright shiny surface that is a poor absorber of radiation and reflects it away. This is a good material because it will not lose much energy. Different surfaces give out and take in different amounts of energy.
- Black paper: A black surface loses energy more quickly and it is a good radiator. It takes and gives out a lot of radiation.
- Lid: A lid can stop the hot water from evaporating because, when the water turns into vapour and rises the lid would block it, so eventually the water would fall back down. To test a container with a lid you must test one also without a lid to see if there is a difference in temperature loss when having a lid on top of the container.
- Bubble wrap: This can be a good insulator because air is a good insulator, so the air in the bubbles would stop the heat from leaving the container. It is very much like a double-glazed window.
- Type of Container: The bigger the container the more the heat loss because there will be more space for the water to evaporate from. The thicker the container the better the insulator it would be, because it will take more time for the heat to go through. There would also be a difference whether the container is plastic, glass or metal, because plastic could also be a good insulator of heat but all metals are good conductors.
- Cardboard: It usually has holes of air between two thin layers stuck together and that would make it a better insulator. Also the thicker the board the longer it would take for the heat to get through, because it has trapped air in between like the bubble wrap and wool.
- From the materials I pick the silver, black paper, wool, cardboard and bubble wrap to test.
I am predicting that the best insulator would be silver because it is a poor absorber of radiation and it reflects it away therefore it would lose the least heat energy.
The second best insulator would be the wool because like many other insulators it contains tiny pockets of trapped air to stop heat being conducted away, which is why it feels warm since it traps a lot of air.
Bubble wrap would be the third best as an insulator because it has bubbles with trapped air that would stop the heat from transferring through, but it would not completely stop the heat. Air is a very poor conductor and a very good insulator.
Cardboard stops heat but not by much and it only traps heat because it is made of two layers of card, so I do not expect it to be the best insulator since there are better ways of trapping the heat energy, for example by radiation.
The worst insulator that I think would lose the most heat is the black paper because it is a good radiator and good absorber of radiation therefore it would let the most heat out.
- Temperature: For every couple of minutes I am going to measure the temperature to see the difference in temperature loss of the water.
- Time: I am going to measure the time of how long it takes for the temperature to decrease, to see which material takes the longest to lose its heat energy in around ten minutes.
- Trial Data (Preliminary Investigation):
To achieve a good range of results, I am going to measure the temperature of hot water in a glass container without it being covered by any materials, to see how much the temperature of the water would fall every two minutes starting from 90°C. I will do the experiment twice, for the first time I am going to pour 100ml of water into the containers and for the second time I am going to pour 200ml of water.
I will be timing for ten minutes, every two minutes because this provides a good range of results in the first couple of minutes in which the greatest and quickest heat loss occurs.
Below is a list of the equipment that I would need to carry out my experiment:
- Five 200ml glass containers
- Kettle
- Stop clock
- Five thermometers
- Black paper
- Silver
- Bubble wrap
- Cardboard
- Wool
- 200ml measuring cylinder
- Collect all the equipment that is needed as shown in the apparatus list above.
- Wrap all the containers with the chosen materials.
- Boil kettle.
- Pour 100ml of boiled water into measuring cylinder.
- Pour 100ml of the boiled water into each container.
- Put a thermometer in each container.
- Wait until the water cools down to 90°C
- Start stop clock
- Record the temperature every two minutes for ten minutes.
- Repeat the whole experiment increasing the amount of the water up to 200ml.
- Silver
- Wool
- Bubble wrap
- Cardboard
- Black Paper
- Silver
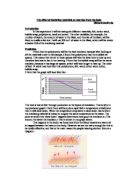
According to my results it turns out to show that silver is the worst insulator for the 100ml testing, which is the total opposite of my prediction. I put one layer of silver around the container because I was looking out to see if it is a poor absorber of radiation.
For the 200ml testing silver is the best insulator and that seems to be quite strange because it looks like the amount of water has made the difference between my two tests. From my graph I can see that the difference between the 100ml and 200ml testing is around 21°C.
I have found out that heat loss is reduced when there is more water added. If I added more than one layer of silver, then the less the heat loss would be.
- Wool
In my prediction I mentioned that wool would be the second best insulator and I was right for both tests. For my 100ml testing the recorded temperature at two minutes seems to be the anomalous result from the way it looks from the graph above. This is because the rest of the results are in a curve where as the odd result has bent the line.
It looks like wool makes a pretty good insulator because its 200ml results are very close to the results of the best insulator.
After all air is a good insulator according to my results because that is what decreased the loss of heat.
- Bubble wrap
Bubble wrap is a poor insulator and the air inside did not keep the heat energy from being lost maybe because it was trapped, but that is a bit awkward because the tiny pockets of air in the wool made a good insulator.
The set of results of the 200ml testing never showed which of the materials made the poorest insulator, because the cardboard and black paper ended up with the same result as the bubble wrap for the recorded result at ten minutes.
From my results I am not sure if bubble wrap is a good or poor insulator for the 200ml testing, but it does not make a good insulator for the 100ml testing.
- Cardboard
For the 100ml testing cardboard made the best insulator strangely, since the results are quite different from the 100ml testing of the other materials, because the experiment was done on a different day so maybe the room temperature made the difference between the results. Therefore, I cannot be very precise about saying that cardboard made the best insulator for the 100ml testing.
Where as the results for the 200ml testing was fair because the tests of all the materials were carried out on the same day.
- Black paper
The black paper did not turn out to be as bad as I predicted. It turned out to be a better insulator than the silver and bubble wrap for the 100ml testing. According to the scientific information a black surface is supposed to be a good radiator but that is not shown from the experiment.
If I had used different types of dull black surfaces then I would probably be able to see if a black surface is a good radiator and absorber.
- This bar chart shows which material made the best insulator and which made the poorest insulator for the 100ml test.
According to my graph above, the best insulator for the 100ml test overall is the cardboard surprisingly because the experiment was on a different day from the other materials.
- This bar chart shows which material made the best insulator and which made the poorest insulator for the 200ml test.
From my graph above, the best insulator for the 200ml test is the silver and this could be because of the fact that the more water in the container the better the radiator it would be.
- After drawing all my conclusions I can now think about the quality of my investigation.
I feel that I was precise when measuring the temperature of the water at the specific time. I measured the water with a measuring cylinder and made sure that the water reached 100ml exactly in the container and the same thing for the 200ml test except the water reached 200ml.
I am not sure about the first result of the wool because it stands out of the cooling curve on the graph. This was like that probably because the wool trapped the heat at that moment, and stopped any heat from flowing through for another two minutes that is why the temperature of the water at four minutes was so close to the temperature at two minutes. This result is anomalous since it looks strange when compared to others.
To get more reliable results I probably should have repeated some of the tests like the 100ml test for the cardboard. I should have done all the 100ml tests of the materials on the same day and if I did the 100ml and 200ml tests of the materials on the same day then I would be able to compare the sets of results more accurately.
To improve my method I think it will be best to add on it that I should repeat the experiment for the 100ml test and 200ml. As an improvement to my experiment I could have put a corkboard underneath the glass container, as this will have reduced the conduction of heat from the glass container into the table.
I think I got a suitable range of results because they show how the test can be improved and what made the differences between the results. If I took more results down then I would have more points for each insulator and that would have made a better and more accurate graph.
There is a pattern in my results because the results on the graph are all in a curve, and it is not only true for the range of values that I used and the pattern would continue beyond this range.