Diagram
Once the optimum temperature has been reached
Safety
To make this experiment as safe as possible I must wear safety glasses to protect my eyes. What I must also be weary of the hot water that will be used and must take caution when using or transporting it. Acid must be used with caution as well and must be used in a safe manner to assure no spillage.
Fair testing
The experiment that is going to be carried out must be a fair test so that I can collect reliable results. To do this I must have the same volume of Sodium Thiosulphate and Hydrochloric acid (10ml) used every time the experiment takes place and at each different temperature. The only thing that will be changed in each separate experiment is the temperature of the liquid I am working with. To defiantly make sure that the experiment is fair I must make sure that both of the liquids (Sodium Thoisulphate and Hydrochloric Acid) are both at the same concentration. I will also make sure that no catalyst used that could speed up the reaction in any of the experiments to make sure that the test is fair and my results are reliable.
Theory
This experiment is based around the collision theory. In temperature it is based on that the higher the temperature the faster the Hydrochloric Acid and Sodium Thiosulphate particles. This then results in frequent collisions in a shorter space of time. The more collisions in a shorter time makes reaction occur in a more rapid time. Thus the higher the temperature the faster the HCL and Sodium Thiosulphate particles move, the faster the rate of reaction thus a speedier time for the solution to become cloudy. The collision theory states that often when the temperatures of both the liquids are increased be 10oc the reaction time is doubled.
Prediction
I predict that the higher the temperature used in the experiment the faster the solution will become cloudy and cover up the cross. I think the speed of the reaction will considerably change from the temperatures 200C to 600C (the rate of reaction will increase). The reason for this is as the heat energy increases more of it is changed to kinetic energy. The kinetic energy is then transferred to the atoms that will allow them to move faster. This means that there will be more frequent collisions in a shorter space of time. The atoms will also have more energy as they collide as well further increasing the reaction time. This then creates the action energy that allows the reaction to occur, thus the solution becomes cloudy. I think that this means that every time the temperature of the solution is raised by 100C (due to the collision theory) the time for the reaction to take place will be twice as fast as a temperature 100C below of what is being used.
Table of results
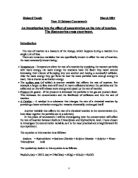
The only anonymous result was the first test at 200C which was 17 (circled in red) and was not used in totalling up the averages. The results were taken to the nearest whole second to make them accurate.
Analysis
The results table and the graph show me that as the temperature increased the rate of reaction increased so the time for the solution to become cloudy decreased. This shows that my prediction was almost correct, but the rate of reaction did not completely double each time the solution was increased by 100C. This can be due to errors in the experiment. To work out the rate of reaction I must divided 1 by the time that I had in my results table that shown how long the cross took to disappear.
Rate of reaction
This table show the rate of reaction of my experiments.
From the table you can see that the rate of reaction when the temperature was 600C considerably faster than when the temperature was 200C. By looking at the results I can see that the prediction I gave that the reaction rate would be double for every 100C was not correct to my results. There are some exceptions though, the results that are in red, green or yellow are each pairs of the results that did correspond to my prediction and the collision theory. This shows that the theory is most likely correct, but the reason for so many results that were not double or nearly double for each 100C rise could have been due to human timing error. The other results are not completely opposite to the theory though. Most of the results are not far of being double the rate of reaction to every additional 100C rise. This means that the experiment was quite successful and gave quite reliable evidence.
The collision theory is similar to my experiment in that as the temperature raised the heat energy was transformed into kinetic energy which made the HCL and Sodium Thiosulphate molecules and atoms move faster to create action energy. The more heat energy there was allowed more kinetic energy, thus more action energy.
The graph of reaction time curves on the line of best fit. The reason for this is that eventually once the temperatures are high enough there will be no considerable change in the reaction time. This is because the reaction in performing at its optimum level and the HCL and Sodium Thiosulphate molecules and atoms cannot move any faster than they already are. This relates to the trend of the graph which moves in a constant line until the temperatures began to be over 400C and 500C.
The reason for this is that the time for the experiments to go cloudy (produce sulphur) was on a equidistant time period from each other from 200C to 400C, this resulted in an even diagonal line until the graph began to curve around 500C. The reason the times were equidistant was due to how the collision theory works in that for every 100c increase in temperature a doubled time for reaction takes place and a diagonal trend to the graph. The reason for the curve of the graph is explained above but to prove that I would have to do further experiments.
Evaluation
The experiment was quite difficult for most of it. The part that was easy was reading the thermometers which were quite simple to read. The most complex detail was making sure that both the amounts of the 1m Hydrochloric acid and 1m of Sodium Thiosulphate were both measured to amount of 10ml before they were combined. This proved the most difficult factor even though with use of the measuring cylinders. Even though the measuring was difficult the amount of liquid that was in the cylinders couldn’t had be far off 10ml due to the markings.
The other difficult part of the experiment was deciding when the cross had completely disappeared, (out of sight). I had to decide whether to wait till just after the solution had become completely cloudy, when most of the cross was covered and when the cross was completely out of sight. Common sense made it obvious that if it was a ‘disappearing’ cross experiment then the cross had to be completely out of sight for it to have been said as ‘disappeared’. Other than those two points the experiment was rather easy without problem.
If I had to do the experiment again I would make sure that the Hydrochloric Acid and Sodium Thiosulphate were from the same batch throughout the experiment to make sure that I don’t have to get a different batch because if contaminated that could alter my results. I would make sure that the measuring of the liquids were done with as much accuracy as possible and spent more time measuring out the liquids to make sure that the amount of Sodium Thiosulphate of Hydrochloric Acid were as similar as possible for each temperature (10ml). The one thing I would change if I had to do the experiment again would be that the water baths could be kept at the temperature needed while I time the reaction, the reason for this is that the water begins to cool down quite quickly when it has stopped being heated by the water bath, this can lead to the experiment being slightly altered. The other equipment that I would use would be a colourimeter. Using the colourimeter would make the experiment as fair as it could possibly be because this would then decide when the solution was completely cloudy or not. This is more reliable that the human eye because what could had been cloudy in one experiment may not had been in another, even though I made sure that I could make the decision as similarly in each experiment as possible. The colourimeter would then decide each time with perfection on what was decided as cloudy on the last experiment therefore all the tests would be timed with more reliable equipment and more reliable results.
Anolumonus results
The only anolumonus result was in the very first test at 200C which reaction time was 17 seconds (circled in red of the table) because it was quite different in the amount of time from that result to the others in that temperature, this then made that result anolumonus. Because it was anolumonus it was not used in working out the average times or reaction. Because the result was anolumonus all the results were taken to the nearest whole second to make them more accurate. The possible reasons for the anolumonus result could have been due to human error in the use of stopwatch in timing the amount of time the test took to become cloudy. The other possible reason for the result was that the cross may had been classed as ‘disappeared’ after it actually was, compared to the other results were the results were most likely classed as disappeared in a different way. Another possible reason why the result is anolumous is because different batches of the Sodium Thoisulphate and Hydrochloric Acid were used during the experiment due to the first batch being used up. The different batch could had been contaminated or a slightly different concentration and made the reaction work at a different rate.
Even though one of the results is anolumonus I can take the results as reliable evidence because the results that were marked in the graph have an obvious trend.
Further work
The further work I could do it test the two liquids (1m Sodium Thoisulphate and 1m Hydrochloric Acid) at temperatures that I did not use. I can take both of the liquids to the lowest temperature possible before they both freeze. On the contrary I can use both the liquids at temperatures and test them before the temperature is so high they evaporate. This would give me a larger amount of results to put onto a graph and look for a larger trend than I have got, it would also allow me to see when the temperature get so high that the liquids cannot react any faster even if I make the temperature higher. I can also se the range from the coldest experiment to the hottest experiment. For further work I could take the results from the temperature in-between the temperatures I have taken.