PREDICTION
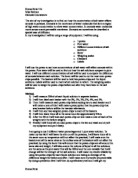
The purer the water, the lower the molarity. The higher the salt content in the water, the higher the molarity.
At “A” on the graph, the solution is hypotonic to the potato cell, because the solution has a lower molarity than the potato cell. I have predicted a gain in mass and percentage change because water from the solution will enter the potato cell to try and balance out the molarities.
Salt cannot pass through the semi-permeable membrane, so it will stay where it was at first.
As the molarity gets nearer to the isotonic point (but still in the “A” region on the graph), the increase in mass will become proportionally less. The solution is still hypotonic to the potato cell, but not by such a large amount, so less water will enter the cell, as less would be needed to balance out the molarities. Potato cells in section “A” will go turgid, because there will be plenty of water pushing against the cells cell walls.
It is impossible for me to predict the isotonic point, because I don’t know the molarity of the potato cell. The isotonic point is the molarity at which the molarity of the cell is equal to the molarity of the solution, so there is no net movement. Therefore, the mass will not change. The isotonic point is shown by the letter “B” on the graph. On the graph I have guessed the molarity of the potato (and therefore isotonic point) to be 0.5, but I have no way of knowing for sure without doing the experiment.
At “C” on the graph, the solution is hypertonic to the cell, meaning that the solution has a higher molarity than the potato cell. Therefore, water from inside the cells will leave the cells to try to balance out and dilute the high salt content in the water. Because water will have left the cell, there will not be much water pushing against the cells cell wall, so I predict that the potato cells in section “C” will go flaccid, meaning that they would become soft and spongy.
This is why I think that the farmer is correct, and it was the high salt content water in the flooding that caused the potatoes to become soft and spongy.
VARIABLES
Independent:
- The salt content in the water (molarity of the water)
Dependant:
- The change in mass and percentage change
Controlled:
- Dimensions of chips are all equal
- All containers containing the different molarities are kept in the same place
- The experiments should all be carried out at the same time to avoid them being at different temperatures.
- They should be left for the same amount of time
- The potato used – should only use one potato as the cells are more likely to be in similar condition
- The amount of solution that the chips are placed in – should be the same amount for each one.
- The number of chips put in each beaker – should be the same.
- Use salt not sugar
Uncontrolled:
- The conditions of the cells – they may be different conditions in different parts of the potato
- The accuracy of the scales – if it is inaccurate, the results may be different.
- What happens to the cells when you are not in the lab – you can’t see what people are doing to it, e.g. somebody might make a hole in the clingwrap.
EQUIPMENT LIST
I am going to need. All equipment can be found in the school lab:
- A chipper – To get chips of equal dimensions from the same potato to make it a fair test, plus it is quicker than using a knife to cut all of it.
- A knife – To cut the length of the chips to equal dimensions to make it a fair test, as the chipper does not make the lengths the same.
- A tile – To cut the length of the chips on.
- A ruler – To measure the length of each chip at 3 centimetres before cutting with knife
- A potato – To make the chips out of - use same potato to make it a fair test. It must be large enough to make eighteen chips out of. A potato is the most convenient food to test on.
- 18 test tubes – To test what effect the 6 different molarities have on the chips, there needs to be a different molarity in each test tube. The experiment will be done 3 times for accuracy all at the same time so 18 are needed.
- Label and pen – to label beakers with molarities and what “attempt” it is, so I don’t get confused what molarity is in what beaker.
- Water with molarities: 0, .2, .4, .6, .8, 1 – different molarity goes in each beaker, to test what effect different molarity water has on potato chips. 20ml of each molarity is required.
- Syringe – To make sure that the same molarity of water goes into each beaker to make it a fair test. It’s more accurate than measuring cylinder. I have chosen 20ml for each beaker.
- Scales – To weigh the chips before and after the experiment, in order to find out the change in mass and the percentage change.
- Test tube lids – To cover the test tube during the experiment to ensure that none of the water evaporates.
- A Calculator – to calculate change in mass and % change.
PLAN
This is how I intend to carry out the experiment:
- Gather all equipment from lab.
- Take potato.
- Cut it so that it will fit into chipper, using knife on tile.
- Put it through the chipper.
- Take chips.
- Cut 18 chips into equal lengths of 3 cm using ruler and knife (there will be 3 attempts for each of the six molarities), throw away any extra chips: you will only need 18.
- Take beakers and get label and pen.
- Stick one label on each beaker and write the molarity of solution, what attempt it is (1, 2 or 3), plus your initials so it doesn’t get muddled up with other peoples.
- Weigh one chip separately, and take note of what that chip weighs in “weight before” section of results table under one of the “molarity” and “attempt” headings, and put that chip in the labelled test tube that you have written the “weight before” under.
- Do Step 9 for all of the chips, putting one chip in each test tube and writing the weight of the chip on the results table.
- Get 20ml of 0 molarity solution in the syringe, and squeeze all the solution into the test tubes that says 0 mol on them (there should be 3 of them because there are 3 attempts).
- Do the same for all other molarities.
- Put lids on test tubes to prevent evaporation.
- Return to the lab the next day, I have chosen 24 hours later.
- Take the chips out of the beakers, making sure you know which chip has been in which molarity solution. You could just put the chip in front of the beaker that you got it from.
- Leave the chips to dry.
- Weigh the chips again, take note of weight in “weight after” section of the results table, and using calculator, calculate change in mass, and % change, and write them on the results table.
- Pack away equipment and throw chips away.
- If you have time, you may want to repeat the experiment again for accuracy.
RESULTS TABLES
INDIVIDULE
The experiment can be repeated up to 3 times.
AVERAGE
To work out the average I will add all of the results for that molarity up, and divide it by the number of results.
RESULTS GRAPH
RESULTS TABLE
To calculate the change in mass I did mass after – mass before.
To calculate the percentage change in mass I did:
mass after – mass before
mass before
Below shows the average for each molarity out of the three attempts.
AVERAGE RESULTS TABLE
I have used averages to only 2dp, and to 1dp on percentage change.
STANDARD DEVIATION
The reason that I am using standard deviation is to analyse the spread of data. The formula for standard deviation is:
S.D. = √∑(x-x-)²
n-1
∑= the sum of; x= each measurement in sample;
X-= the mean of the sample; n= the sample size
This is how I worked out the top part of the formula.
“n” is the sample size, and I had 3 attempt,
so “n – 1” = 3 – 1 = 2
EXPLANATION
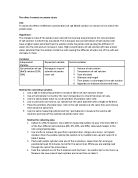
Firstly I will start off with an explanation of the dashed lines between 0.2 and 0.6. This is simply to show how I believe the graph would have looked like if there wasn’t an anomaly. The graph shows the isotonic point to be about 0.22 molar.
The graph also shows that as the molarity increases, the mass of the chip decreases. With high molarity the water in the cell will be lost as it is hypotonic. While the lower the molarity, the cell becomes turgid and gains water.
Evaluation
My prediction was partly correct. The graph generally has a negative gradient, as I had predicted.
I was correct in thinking that water would go into the cell from the solution because the solution was hypotonic to the cell. This is why there is a gain in mass in the molarities lower than 0.22 (the isotonic point).
I was also correct in thinking that the potato cells that were hypertonic to the solution would go turgid, because there is more water pushing against the cell walls.
I also knew that it would level off after a certain point, because it was limited to the amount of water in the cell.
I was incorrect in thinking that the higher the molarity above the isotonic point, the higher the percentage mass loss. But this may be contributed by the anomaly for 0.4.
However there are some things on the graph that I think may be incorrect. I have one anomalous result. It is 0.4M. I think that the graph should not be so steep, and should possibly level off a bit.
Instead, the line is extremely steep. I think that they should be less steep because the solution isn’t that much more hypertonic to the cell at a higher molarity.
It might level off a bit because as much water as possible will have come out of the cell and into the solution. This means that even if you have a higher molarity than the minimum molarity when it uses up maximum water, the percentage mass loss from the potato cell can only be the same. This is because it is limited to the amount of water in the cells.
GOOD AND BAD THINGS ABOUT THE EXPERIMENT
I think that using the chipper was good because it was a lot more accurate than just cutting them into the required shape using only a knife and ruler. Not only was this more accurate, it also saved a lot of time.
The experiment was repeated 3 times for each molarity solution, which give quite reliable results. More repeats would have given a more reliable result.
Doing all the repeats on the same day was also a good idea, because on different days they would be under different temperature and conditions, and that may have had a different effect on the chip.
However, I think that me using the ruler was inaccurate, and the large difference in mass shows this. My smallest mass when starting was 2.43 and my largest was 2.75. There is a 12% difference in mass between these two chips, and since the chipper made sure that the height and width of the chips were all the same, it must have been my mistake, not measuring exactly 3cm, although I cannot think of a practical alternative to this problem apart from to spend more time making sure it was exactly 3cm.
One main thing that I may have affected my results was the time I left it for, 24 hours. I think that this may have been too long.
I had to spend a long time labelling all my test tubes. It would have saved a lot of time if we could write directly onto the test tube with a pen, or had pre-labelled test tubes.
Another reason was because it was so crowded in the classroom. We had 23 people all doing the experiment at the same time, and so there was some waiting while trying to fill up the test tubes with the required molarity solution. I think an alternative to this would be to do the experiment with about six people at a time instead.
It was also easy for other people to tamper with them, as I couldn’t be in the room the whole time watching them. I think an alternative to this would be to keep them in a locked room.
Another possibility is that the scales were not accurate. An alternative to this would be to buy more accurate scales, possibly accurate to 3dp instead of the 2dp ones that I used.
There are many reasons as to why I might have got the two anomalous results. They both had a very high standard deviation, which suggests that the results for those molarities were not all that accurate. 0.8 had a standard deviation of 5.67, and 1 had a standard deviation of 4.405.
It could be that in one of the attempts I put far too much or too little amount of solution into the test tube. The syringes could only fit 10ml into them at a time, and I chose to use 20ml to test. This meant that I had to do two syringe squirts into each test tube, but I may have accidentally done 1 or 3 and not noticed. This would be a likely case if there was one result that looked wrong, but there is no one result that stands out, so I don’t think that it was because of this. A solution to this would be to either use 20ml test tubes or only 10ml solution.
Another possibility is that I did not use exactly 10ml, but something close to it. For example it may have been 9.5 but I thought that it was close enough to 10ml, and so added it instead, or I may have misread the syringe slightly. I was in a hurry, so I probably didn’t spend enough time checking that I had exactly 10ml in the syringe before squirting it into the test tube. This would not have had such a great change as adding a whole extra 10ml syringe squirt, but would have altered the results slightly.
We had large bottles of each molarity solution, and small bottles. We poured some solution from the large molarity bottles into the small molarity bottles, and took solution using the syringe from the small bottle. Somebody could have poured the wrong solution into the wrong bottle, for example poured the 0.2 molarity solution from the big bottle into the 0.8 molarity small bottle. This would mean that the bottle that was supposed to be 0.8 molarity would now be a mixture of 0.8 and 0.2 molarity solutions. I would then have taken this solution thinking it was 0.8 mol. I think this is quite likely as there were a lot of people all doing the experiment at the same time. This pattern also occurred on other people’s results graph, which is further reasoning why I think this happened. It did not affect the whole class, probably because they added the solution before it got affected.
It could be that I was inaccurate when I was cutting the chips, and didn’t make them all exactly 3 cm. However, this change would only have had a slight effect as I know that I definitely cut them at approximately 3cm (possibly a millimetre or two out), and does not explain what I believe to be the totally incorrect results.
The different masses of the chips could have had an effect, but since I did percentage change, it shouldn’t matter too much.
It could be that the cells for the anomalous results were in a different part of the potato to the other cells, for example nearer the skin.
I didn’t wash the test tubes before adding the chips and solutions, so it could be that some of them were dirty, or if a different class had done the same experiment before there could have been some different molarity solution in them.
As I said in the “Variables” section of the Plan, there were some things that I could not control. There may have been different conditions in different parts of the potato, for example nearer the skin. The cells nearer the skin may have had more or less water in them, so this would affect at what percentage change they stopped giving out more water, and therefore where on the graph it would level off.
I would need to repeat the test for molarities 0.8 and 1.0 to see if my prediction is correct or the results are correct.
In general, the results follow what I had predicted, and I now have evidence to back the farmer’s case.
To see whether the farmer was correct in thinking that the higher molarity water was the cause of his potato crops doing badly, you would need to find out the molarity of the estuarine water. If the water is 0.17 mol or below, then the estuarine water had a good effect on the potatoes. If the water is higher than 0.17 then the farmer is correct and deserves compensation.
FURTHER EXPERIMENTS
What further experiments could I do? I could repeat this experiment for further accuracy. I did this experiment in the winter, in cold conditions, so I could do it in the summer to see what effect temperature has on it. For further accuracy I could put a number of the experiments under a different, set temperatures. Warmer temperatures usually speed up reactions, so for this experiment I would predict that the warmer it was, the quicker the mass would change. I could also see whether using old potatoes had a different effect than using new potatoes, or using the skin had different results than using the centre of the potato.
I could find the exact isotonic point by using molarities nearer to 0.17. For example I could do: 0.16, 0.165, 0.17, 0.175, 0.18, 0.185.
I could try it on a different pH food, rather than potatoes, or use sugar instead of salt.
I could also change the surface area of the chip, or the amount of solution put into the test tube.
I could leave the experiment for different amounts of time, e.g. 30 mins, 1 hours, 2 hours, 4 hours, 8 hours, 24 hours, and see what effect that had on it. I think that at first there would not be a large percentage change as it would not have had enough time for the movement of water molecules to take place. Eventually the graph would level off.
I could use a different amount of molarity solution. For example I could see what difference there was using less or more than 20ml.