- Homogenise the potato in a pestle and mortar
-
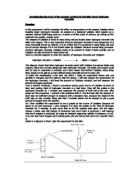
I will take 10ml of hydrogen peroxide and place it in a measuring cylinder.
-
To the measuring cylinder I will add 1.5g of homogenised potato, which contains the enzyme catalase.
- I will then time it for 1 minute, and take a reading to see how much oxygen foam has been produced; I will do this again after 2 minutes, then after three minutes.
- I will do this 5 times in total, once with each concentration. The concentrations are 2.5 vol, 5 vol, 10 vol, 20 vol, and 25 vol.
- I will then repeat the entire experiment.
I have chosen 2.5 as it is the lowest reasonable concentration that will show a result. 5, 10 and 20 vol as they are twice the concentration of the one before it and 25 as it is the highest concentration that is safe to use. Above 25vol the hydrogen peroxide becomes corrosive and the experiment would have to be performed under close teacher supervision in a fume cupboard. This is not possible.
To make the experiment fair I will keep everything the same and only vary the concentration of hydrogen peroxide. I have used doubling concentrations in the hope of seeing a pattern in my results.
APPARATUS
10 ml 2.5 vol hydrogen peroxide
10 ml 5 vol hydrogen peroxide
10 ml 10 vol hydrogen peroxide
10 ml 20 vol hydrogen peroxide
10 ml 25 vol hydrogen peroxide
5 measuring cylinders
5 weighing boats
1 pestle and mortar
Safety glasses
Scalpel
Stop watch
Electronic balance
Tile
Potato
POSSIBLE VARIABLES
Variables – In this investigation, the variables that affect the activity of the enzyme, Catalase, were considered and controlled so that they would not disrupt the success of the experiment.
Temperature
As temperature increases, molecules move faster (kinetic theory). In a reaction involving enzymes, such as the decomposition of hydrogen peroxide, this increases the rate at which the enzyme and substrate molecules meet and therefore the rate at which the products are formed. As the temperature continues to rise, however, the hydrogen and ionic bonds, which hold the enzyme molecules in shape, are broken. If the molecular structure is disrupted, the enzyme ceases to function as the active site no longer accommodates the substrate. The enzyme is denatured. To control this variable, the temperature was maintained at a fairly constant level that allowed the enzyme to work effectively (room temperature, approximately 23°) this is to allow the experiment to be a fair test.
Concentration of Catalase within the Potato and
Area of potato
This is one of the reasons why I am homogenising the potato, so that the potato in each experiment has the same over all amount of catalase. If there were more molecules of catalase in the same volume, the frequency of collision would go up, because there would be more molecules of catalase for the hydrogen peroxide to collide with. This would make it an unfair test. If there were fewer molecules the frequency of collisions would go down because there would be less molecules of catalase for the hydrogen peroxide to collide with.
Concentration of Hydrogen Peroxide (substrate)
The concentration is the one factor I intend to vary. I will use 2.5 vol, 5 vol, 10 vol, 20 vol, and 25 vol. The first four double so I should see a pattern and 25 vol because it is the highest I can safely use. 2.5 vol is the lowest concentration that will show a result. Otherwise there are not enough hydrogen peroxide molecules to produce enough oxygen to accurately judge the volume produced, which is indicative of the rate of reaction.
Enzyme Concentration
Provided there is an excess substrate, an increase in enzyme concentration will lead to a corresponding increase in rate of reaction. As I am homogenising the potato this should not matter.
Volume of Hydrogen Peroxide
I will use 10 ml for each experiment. This will be measured in a measuring cylinder.
Type of potato
I will use the same potato for all the experiments to make it fair.
RESULTS 1
RESULTS 2
Analysis of Results
I have graphed the total volume of oxygen produced and have the drawn a line of best fit to show what I think should have happened. This is because although 2.5vol, 5vol 10vol and 20vol all roughly double, 25vol on my graph is a long way off what it should be. In all cases the rate of reaction was fastest in the first minute, this is because in the first minute there is lots of hydrogen peroxide. Which is decomposed by the catalase very quickly, by the catalase, this happens because the frequency of collision is greater due to a higher concentration of hydrogen peroxide molecules in the same volume. In the second and third minutes, there are no where near as many molecules of hydrogen peroxide in the same volume, because they have already been broken down into oxygen and water, therefore the decomposition is slower, because it takes longer for each molecule of catalase to collide with a molecule of hydrogen peroxide.
The result highlighted in pink, I have labelled a1 (anomaly1). This is because it is nowhere near the others, the total volume of oxygen produced shouldn’t even have doubled from 20vol, instead it has more than trebled. The only thing I can blame this on is that maybe the other concentrations were far older, therefore had partially decomposed already. This is also the same with the first set of results; there should have been a 25% increase in volume of oxygen produced between 20vol and 25vol, instead it approximately doubled. This supports the theory that the 25vol may have been made up far more recently. Hydrogen peroxide decomposes to hydrogen and water naturally over time. So if the other concentrations had been made up a while ago, then this would have already started to happen, meaning there would be fewer molecules of hydrogen peroxide for the catalase to decompose. This may also explain why there is no increase in total volume of oxygen between 5vol and 10vol in the second experiment, although in the first experiment, excluding the result for 25vol there is a reasonable pattern of doubling. In the second experiment 2.5vol to 5vol more than trebles, 5vol to 10vol doesn’t increase and 10vol to 20 is the only one that nearly doubles.
I have also done two graphs comparing the rates of reaction for each concentration in each experiment. This is so I could look at the rates of reaction and see the way the rates of different concentrations change each minute. With 25vol in the first minute the rate of reaction is significantly higher than in the second and third minutes, this is not true with the other concentrations, where the rate of reaction decreases by about the same amount each minute. Also as the concentration decreases, the gradient of the line also does, this tells us that there is less difference in the rate of reaction between the first second and third minutes. I think this is because in the higher concentrations, there are far more molecules to start with in the same volume this means a greater frequency of collision. To show this I have calculated the gradients of the lines. On a straight line the equation for this is:
y2-y1
x2-x1
This gives me the gradient which I then out into the formula y = m x + c, where m is the gradient, x is the value of x and c is an unknown constant.
This means that I pick two points on the line as far apart as possible these are (x1, y 1) and (x2, y 2)
25vol – (1.5, 8) and (2,5.6)
y2-y1 = 5.6 – 8 = - 2.4
x2-x1 = 2 - 1
-2.4 is the gradient, this tells you how steep the line is.
20vol – (1.5, 4.8) and (2,4)
y2-y1 = 4– 4.8 = - 0.8
x2-x1 = 2 - 1
- 0.8 is the gradient
10vol – (1.5, 1.9) and (2,1.5)
y2-y1 = 1.5– 1.9 = - 0.4
x2-x1 = 2 - 1
- 0.4 is the gradient
5vol – (1.5, 1.3) and (2,1)
y2-y1 = 1– 1.2 = - 0.3
x2-x1 = 2 – 1
- 0.3 is the gradient
2.5vol – (1.5, 0.6) and (2,0.4)
y2-y1 = 1– 1.2 = - 0.2
x2-x1 = 2 – 1
- 0.2 is the gradient
Conclusion
In conclusion I would say that my prediction was probably right although due to a lack of accuracy in the experiment, I cannot be certain. However my results do roughly double as the concentration doubles and, it is shown that the more concentrated it is, the faster it is broken down by catalase, which is what I predicted would happen. My table of results, graphs and working out the gradient all show that as the concentration is increased, there is more oxygen produced.
EVALUATION
Fair testing: The experiment was not a fair test, this is because
- We did not use the same mass of potato
- We did not measure the volume of oxygen accurately
- We did not measure the surface area of the foam
- The experiments were not timed accurately
- The measurements were taken by different people
To make the experiment fair if I were to repeat it I would
- Homogenise the potato in a food processor
- Take the mass of the potato on an electronic balance
- We would have to find a way of measuring the concentration of catalase or only use potato from the centre. Homogenising the potato would also help to make sure that there was the same concentration.
- Put a bung in the top of the test tube and use a gas syringe, which would measure the gas far more accurately then the method I used originally.
- One person should take all the readings to reduce human error.
- This is a plan of how would do the experiment if I were to repeat it.
- Take more readings, more often to get a better range of results
PLAN
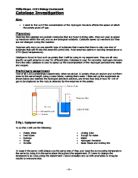
- I will homogenise a potato in a food processor
- I will take 10ml of hydrogen peroxide and place it in a conical flask
- To the conical flask I will add 1.5g of the homogenised potato, which contains the enzyme catalase.
- I will then place a bung in the top of the flask and attach a gas syringe to it.
- I will then time it for 30 seconds, and take a reading to see how much oxygen has been produced; I will do this every 30 seconds, for 3 minutes.
- I will do this 5 times in total, once with each concentration. The concentrations will be 2.5 vol, 5 vol, 10 vol, 20 vol, and 40 vol.
- I will then repeat the entire experiment four more times. In order to take a better average of the results.
I have chosen 2.5 as it is the lowest reasonable concentration that will show a result and 5,10, 20 and 40 vol as they are twice the concentration of the previous one. To use 40 vol hydrogen I would have to do the experiment in a fume cupboard, to keep it safe, as it is highly corrosive and the fumes are not safe to breathe.
To make the experiment fair I will keep everything the same and only vary the concentration of hydrogen peroxide. I have used doubling concentrations in the hope of seeing a pattern in my results.
APPARATUS
10 ml 2.5 vol hydrogen peroxide
10 ml 5 vol hydrogen peroxide
10 ml 10 vol hydrogen peroxide
10 ml 20 vol hydrogen peroxide
10 ml 40 vol hydrogen peroxide
5 conical flasks
5 bungs
1 gas syringe
5 weighing boats
1 food processor
Safety glasses
Scalpel
Stop watch
Electronic balance
Tile
Potato
POSSIBLE VARIABLES
Temperature,
Concentration of H2 O2,
Volume of Hydrogen Peroxide,
Mass and area of potato,
Type of potato,
Freshness of things such as Hydrogen Peroxide and potato,
Type of measuring cylinder,
Time
HOW I INTEND TO CONTROL EACH FACTOR
Temperature
The experiments will be conducted in the same room at roughly the same time so in all probability the temperature will be the same.
Concentration of Hydrogen Peroxide
The concentration is the one factor I intend to vary. I will use 2.5 vol, 5 vol, 10 vol, 20 vol, and 40 vol. They all double so I should be able to see a pattern in the results that relates to this fact. I.e. that the volume of oxygen produced should double because double the concentration means double the number of H2O2 molecules IN THE SAME VOLUME. I have started with 2.5 vol as I think it is the lowest concentration that will show a result. I also intend for all the H2O2 to be made up on the same day to keep the experiment a fair test.
Volume of Hydrogen Peroxide
I will use 10 ml for each experiment
Area of potato
I will use 1.5g of homogenised potato. By homogenising the potato I intend to ensure consistency in area and the concentration of catalase.
Type of potato
I will use the same potato for all the experiments to make it fair.
Concentration of Catalase within the Potato
This is one of the reasons why I am homogenising the potato, so that the potato in each experiment has the same over all amount of catalase.
Results of Follow-up Experiment
Results of Follow-up Experiment (2)
Conclusion
This experiment was far more accurate than the previous one, however the results were still well off what would be expected for 25vol. This leads me to believe that something else is affecting that experiment. For the second experiment all of the hydrogen peroxide concentrations were made up at the same time, so this would not have been a factor. The first three results were just about perfect, each doubling. This shows that whatever it is that is causing the change in the pattern, only affects the strongest concentrations.