Buffer solution (pH 8.5)
Safety Materials
Laboratory coat,
Goggles,
Gloves.
Method
The developed film was cut into twelve squares measuring 0.5 cm x 0.5 cm, with some spares. This was done using forceps to hold the film against a ruler to be as accurate as possible. Using forceps also helped to avoid skin touching the film. The supplied 1% trypsin solution and buffer solution was poured into two separate beakers. The trypsin solution was then syringed into a new beaker to make up 10 cm3 0.5% trypsin solution. Table 1 shows the volumes of 1% trypsin solution and buffer solution used, to make up the new concentrations. This was also repeated to make up 10 cm3 0.1% trypsin solution. Then the 0.5% trypsin solution was used to make up 10 cm3 of 0.05% trypsin solution, all shown in table 1. Different syringes were used per concentration; therefore 2 cm3 of each concentration was then syringed into a set of three test tubes for each. A test tube containing one of the concentrations was placed in the water bath, and then stop clock was started. This was left in for 2 minutes to equilibrate. The times were recorded for when they were placed in water bath. After the 2 minutes, a square of film was added to the test tube, while the stop clocked continued. The test tube was frequently checked to see if there was any sign of digestion of the gelatine from the photographic film. The test tube was shook every time it was checked. The time taken for the digestion was recorded. This was then repeated for all the other test tubes, for the different concentrations, and all times were noted.
All staff and students must be aware of the fire exits are and be able to locate the first aid kits. Safety goggles and lab coats must be worn in the laboratory at all times as part of a safety precaution, as must gloves when using irritant fluids. There must be no food or drink consumed, no smoking, running or throwing of equipment in the laboratory as it is prohibited. In case of any spillages or accidents with chemicals, wash with excess water.
Results achieved
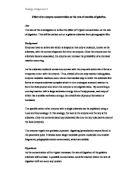
Table 1: The volumes measured and calculated to be used for the different concentrations of trypsin solution.
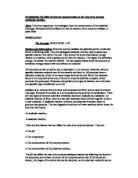
Table 2: The time taken for the different trypsin concentrations to digest the gelatine from the photographic film, carried out three times with same concentration.
From the above raw data, the following calculations were carried out, to find out the length of time taken for digestion, the time in seconds, the rate of digestion per film, the average rate of digestion and the standard error in each set of experiments.
For test tube 1 at 0.05% concentration, actual time = Finish – start
= 27:04 – 02:00
= 25:04
This was repeated for each test tube for every concentration.
The time in seconds for this test tube = (minutes * 60) + seconds
= (25*60) + 04
= 1504 s
All the times were converted to seconds for all concentrations.
Rate of digestion for this test tube = 1 / time in seconds
= 1 / 1504
= 6.65 x 10⁻⁴ s-1
Again rate was calculated for all the experiments. In each case the size of photographic film was kept constant, and therefore 1 has been used as the constant to calculate this rate of digestion per concentration.
For 0.05% the rates were:
Thus the average rate of digestion was calculated using these results.
= rate of test tube 1 + rate of 2 + rate of 3
3
= 0.000665 + 0.000668 + 0.000667
3
= 6.66 x 10⁻⁴ s-1
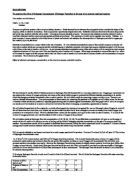
The standard errors for each of the digestion rates were calculated by taking away the mean from the highest value, and taking away the lowest value from the mean. This then resulted in the following table with rates of digestion, and standard error occurrences.
Table 3: The rate of reaction can be found by dividing the time taken for the enzyme to digest the protein substrate by one. The average rate of reaction was then found by adding the three readings for each concentration and dividing by three. Standard error is the time
Discussion
The hypothesis made at the beginning of this investigation, that the rate of digestion will increase as the concentration of trypsin increases is confirmed through the results obtained.
At the lowest concentration of 0.05%, the time taken for digestion, in minutes and seconds was 25:01. This was a very long time for digestion, though we know that at low concentration of enzyme there are a low number of active sites and so there is less chance of enzyme – substrate complexes to be formed. This is why the rate of digestion was as low as 0.000666 s-1 in comparison to 0.1% concentration. When the concentration of trypsin was increased to 0.1%, there was a moderate increase in the rate of digestion as seen in the graph. The time taken for digestion at this concentration was 15:59 on average; therefore once again the rate was slow at 0.001043 s-1. There is a significant increase in the rate of digestion at the concentration of 0.5% trypsin. The digestion took 07:06 and had a faster rate of digestion of 0.002346 per second (table 3). According to this investigation the highest concentration of trypsin solution, being the 1%, produced the maximum catalytic activity with a rate of digestion of 0.005193 s-1. This was the Vmax from the graph. Here there was a lot more active sites for more enzymes – substrate complexes to form, hence the rate of digestion was high.
The photographic film containing the gelatine was cut into small squares using scissors. These caused errors, as the size of the squares were very small, and every square were not exactly the same, making the digestions unfair. The timing of each digestion could also have caused errors, as a single person was placing the squares of film into the test tubes and concurrently pressing start on the stop clock. The timing must be precise here, and this would allow for human error to occur. The film stuck to the side of the test tube at times, and also was not visible within the water bath and therefore this meant that time was lost for digestion to occur. This led to the error bars shown in the graph for the 1% trypsin concentration, as this had the fastest rate of digestion.
Methods for improving future investigations include timing the shaking of when the test tubes are taken out of the water bath so that the kinetic energy of the enzymes are not affected by the possible change in temperature. As this is nonetheless, supposed to be a constant in the investigation. Using a clear water bath would help with this, as there would be no need to take the test tubes out of the water bath. A second person to help start the stop clock would reduce errors in timing as vital seconds become unaccounted for when transferring the photographic film to the test tube and trying to start the stop clock at the same time. The tests could be carried out individually opposed to concurrently running them because checking for digestion lead to discrepancies in the time each test tube spent out of the water bath, which again affects the kinetic energy of the enzyme. The cuttings of photographic film with gelatine on could have been measured as larger pieces so that fewer errors occurred in trying to keep a constant size.
In conclusion the time taken for digestion of the gelatine substrate was inversely proportional to the concentration of the trypsin enzyme, hence the rate of reaction increased as the enzyme concentration was raised.