Five experiments are going to be carried out using different concentration levels of the solution by:
-
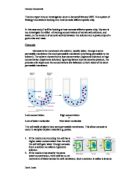
In the 1st test tube place 10 cm of the solution measured by a syringe.
-
In the 2nd test tube measure 7 cm of the solution and add water until the final volume will be 10 cm. This gives a concentration of o.7 mole.
-
In the 3rd test tube measure 5 cm of the solution and add water until the final volume will be 10 cm. This gives concentration of 0.5 mole.
- Change the conc. in the next two test tubes as shown above.
To make it a fair test by using the same conditions:
- Initial temp. (Room temperature).
- To keep the water potential of the potato initially will be kept the same by using the same type of potato, which have been treated in the same way, e.g. have all been cut without being washed and peeled.
- The mass of the potato is a dependent variable, and this means that it will be measured
- Measure the mass in grams. The potato chlip will be measured before it is put in the solution, and after. This will allow me to see whether osmosis has taken place, and to what extent.
- The volume of the solution that the potato chlips are kept in must be fair. They must be totally covered in the solution, and the amount of the solution will be kept the same because all the potato chlips are the same size.
- I am also going to use the same balance to weigh my potato chlip. This is because the measurements may slightly vary beyween scales.
- Use different syringes, one for the salt solution and one for the water.
- Clean the potato clip before weighing it.
Variables:
To create a fair test certain aspects of the experiment will have to be kept the same whilst one key variable is changed. I have chosen to vary the concentration of the sugar solution. This will give me a vary varied set of results from which I hope to make a decent conclusion. If any of the non-variables below are not kept constant it would mean it would not be a fair test. For instance if one of the potato chips was 1cm longer the surface area of the chip would be larger and there would therefore be more space for osmosis to occur.
4- Precision
For accurate results, I will not carry the potato chlip with your hand, I will Leave the test tubes for about 30 minutes before puting the potato chlip in order to have the same initial temperature (room temperature), I will be carful not to hold the test tubes with your hands during the experiment to avoid heat transfer, The stopwatch must be started at the exact time as we put the potato chlip into the test tubes, and I must Dry the potato chlip before weighting.
5- Prediction
I predict that the lower the concentration of the sugar solution in the test tube the larger the mass of the potato will be. This is because the water molecules pass from a high concentration, i.e. In the water itself, to a low concentration, i.e. In the potato chip. Therefore, the chips in higher water concentrations will have a larger mass than in higher sugar concentrations.
6- Resources
- http://www.edexcel.org.uk
- http://www.essaybank.co.uk./GCSE/biology_coursework
- Dr Amad, Biology notes OL, part one, Dar Eltarbiah, Year 2002-2003, page 41, 43
II. OBTAINING EVIDENCE
Precautions
(a) For personal safety
● Be careful while using the Scalpel.
● Wear white coat to protect ure clothes from the chimecals in the labe.
(b) For accurate results
● Don’t carry the potato chlip with your hand.
● Leave the test tubes for about 30 minutes before puting the potato chlip in order to have the same initial temperature (room temperature).
● Don’t hold the test tubes with your hands during the experiment to avoid heat transfer.
● The stopwatch must be started at the exact time as we put the potato chlip into the test tubes.
- Dry the potato chlip before weighting.
I am sure that I have enough evidence to allow me to draw a conclusion. This means that I have large number of readings. My evidence is quiet good that I am sure of the consistency of my results, that nothing of them varies a lot, then I will not repeat any of the readings.
Results
The table of results below shows the followings:
III. ANALYSING EVIDENCE
Graph:
The graph shows that The graph above shows a simple curve obtained when the concentration of the solution is plotted against the percentage change in mass.
My graph is a smooth one, which means that none of my results are odd.
Conclusion:
I have found that and my results show that
At point A the graph tells the viewer that no osmosis has occurred, suggesting that the concentration of water inside the cell is equal to the solution outside which is 0.6 mol/dm3.
At point B (high water concentration), there is no indication that the cell is increasing further in size. This is because the cell is fully turgid and no more water can enter.
At point C (low water concentrations), there is no indication that the cell is decreasing further in size. This is because the cell is fully plasmolysed and no more water can leave the cell.
IV. EVALUATING EVIDENCE
The procedure used was carried out well, and the results obtained were within predicted parameters, but it could have been improved, and these improvements will be listed later. The results are mainly good, and this could mean that the experiment was done perfectly. Although all the average times and rates of reaction conform to a pattern, they are not all evenly spaced, and are therefore probably not perfect. The results could be correct, but the results did not appear to be exactly uniform.
I believe that I do have an accurate set of results and that I do have enough results to be sure about my conclusion. I do not have any anomalies results, which do not fit in the pattern because my predictions coordinated with my results very well.
My method of carrying out the experiment was fairly accurate. I made sure to wash the test tube carefully for the two levels of concentration. The second experiment, I measured the same amount of solution in each time and stopped the stopwatch as soon as the time required to leave the test tube Is finished. I think that I should have used five different test tubes for the five different concentrations because this would be more accurate, fair as the test tubes will be dry.
If I was to do the experiment again, I could improve the accuracy and reliability of the results by having a range of different concentrations. Also I could use the same amount of test tubes for the number of different concentrations I used.
If I had more time, I could do additional experiments to investigate another factor such as the effects of varying concentration of a certain solt solution on the amount of osmotic activity between the solution and a potato chip of a given size.
Improvements that could be made to this experiment:
To repeat this experiment several times and record more averages in order to obtain a higher degree of accuracy.
In my experiment, I believe this experiment was carried out to the best of my abilities, and is the optimum performance using all possible resources and time available. The results obtained, which seem reliable, supported my predictions.