Analysis and Conclusion
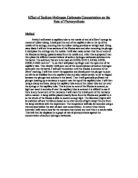
The resulting tabular and graphical evidence show some good results. From the data collected and collated I plotted the points on a graph of the rate of photosynthesis (mm) against the concentration of sodium hydrogen carbonate (mol dm-3). This gave me one graph from the data collected. The graph shows the whole range of sodium hydrogen carbonate concentrations used and the average distance the meniscus moved in millimetres during nine minutes, for each concentration. The graph shows the trend that as the concentration increases, the average distance the meniscus moves also increases. Therefore as the concentrations become more concentrated the amount the meniscus moves increases. My results show that at lower concentrations the meniscus moved only a small distance but as the concentrations increased the distance moved by the meniscus increased rapidly.
From concentrations 0.0100 mol dm-3 to 0.0125 mol dm-3 there is an increase in distance moved by the meniscus but at a slower rate signifying that enough carbon dioxide is reaching the Elodea. This is shown in the graph as the gradient of the line slowly increases but is fairly gentle.
From concentration 0.0166 mol dm-3 onwards the distance the meniscus moves, increases at a quicker rate. This shows that the supply of carbon dioxide reaching the Elodea is declining. This therefore on the graph is shown as a steeper gradient. At concentration 0.0500 mol dm-3 a significant change in gradient can be seen as it becomes steeper due to the supply of carbon dioxide deteriorating.
The last reading taken at 0.1000 mol dm-3 shows a significant increase on the graph as the gradient becomes much more steeper and inclined.
The results have given me a trend and pattern showing that as the concentration of the sodium hydrogen carbonate increases the distance the meniscus moves increase, though they could be inaccurate due to inaccuracies in the method and also because I have only obtained one set results they could be unreliable. Even though it seems that I do not have anomalous points.
The table of results show the data I have collated. They show the different concentrations of sodium hydrogen carbonate used. It shows the average distance the meniscus moved in nine minutes. Overall it seems that the data I collected are moderately accurate though maybe unreliable. It also shows the distance it moved in the first 3 minutes and then in the next 3 minutes up till nine minutes. My results table also shows the temperature around the Elodea, which indicates if temperature effects the results. From the results it seems that the temperature was fairly constant so would have as little effect as possible on the results obtained. Using an average eliminates the error of single data and makes the results obtained slightly more accurate. From the results table I can see that between the concentrations of 0.0100 mol dm-3 to 0.0125 mol dm-3 there is a increase in movement of the meniscus. In the concentration of 0.0100 mol dm-3 the largest movement of the meniscus was three millimetres showing that enough carbon dioxide is reaching the Elodea. In the concentration of 0.0125 mol dm-3 the movement of the meniscus has increased but only buy a few millimetres. There is a steady increase till 0.0250 mol dm-3. In the concentration of 0.0250 mol dm-3 between the 3 minutes from 3 to 6 there was a significant movement in the meniscus of 15 millimetres. Therefore showing the carbon dioxide level reaching the Elodea must have declined a great deal to force the Elodea to increase the carbon dioxide intake. Though after this, the amount the meniscus moves goes back in concordance with the rest of the results. This may show an anomalous result but after calculating the average the results fall back into concordance. In the concentration of 0.0500 mol dm-3 a significant increase can be seen of the movement of the meniscus. The movement of the meniscus in the first 3 minutes is 9 millimetres and in the next three minutes the movement of the meniscus increase to 18 millimetres. There is also a significant increase in the last 3 minutes for 15 millimetres. In the last concentration tested 0.1000 mol dm-3 the results table show that here is the largest movement of the meniscus. It shows a much larger increase than any of the other concentrations. This indicates that the amount of carbon dioxide reaching the Elodea is very minimal.
I have drawn error bars on the graph to show whether or not the points passes through the line if the maximum and minimum values are place on the graph. The line does pass through each error bar and therefore I have been fortunate not to have any anomalous points. The lengths of the error bars indicate that some of the readings were more accurate than others. The shorter the error bars the more accurate the reading and the larger the error bars the more inaccurate the reading.
The error bars indicate the inaccuracy between the readings taken therefore showing that the results obtained are inaccurate. If the results obtained had no error then the results are said to be perfect, but with inaccuracies in my method my results here as shown to be unreliable.
I can conclude that as the sodium hydrogen carbonate concentration increased the distance the meniscus moved also increased. As it reached higher concentrations the distance moved by the meniscus moved further and further down the capillary tube.
Evaluation
This experiment was carried out as accurately as possible in the circumstances given. I worked thoroughly and had no problem in carrying out my procedures. However there are many improvements that can take place for this experiment. Overall the results seem fairly accurate and they’re no anomalous results.
From the experiment I realised that the apparatus chosen was generally suitable for the experiment in hand. There were some inaccuracies in measurements due to the ruler having an inaccuracy to it and not starting the measurements at the end but a little way up.
These results obtained though are inaccurate due to limitations in the procedure/ method. The method was flawed due to lack of organisation and time. Attaching the capillary tube to the nozzle via the rubber tubing proved to be tricky because the capillary tube would become loose and fall out. This meant that there wasn’t an airtight seal showing the results obtained are inaccurate. Therefore due to the inaccuracy of the airtight seal meant carbon dioxide was able to reach the Elodea. To push out all the air bubbles trapped in the barrel of the syringe and of the capillary tube proved to be difficult. When pushing the plunger down the pressure would slowly push out the air bubbles but some air was still left inside the barrel therefore would affect the experiment and therefore consequently affect the results. When pulling back the plunger to draw back a single meniscus, more that one and air bubbles would be pulled back therefore causing a blockage in the capillary tube. The air bubbles prevent anything passing through it therefore causing the results to become inaccurate. Due to the experiment being carried out in the dark it was difficult to mark exactly the point where the meniscus was at the start therefore the measurements of the movement would be inaccurate. Also when measuring the meniscus touching the rubber tubing would cause the meniscus to oscillate and therefore the new measurement of the meniscus would be in the wrong place. This therefore would mean the results are again inaccurate. Placing a lamp 8cm from the Elodea proved to be difficult because the clamp and stand would cause an obstacle. The lamp was therefore not 8cm away from the Elodea but slightly more. The laboratory blind, which were closed, still let in a little light from the sides and as there where other lamps in the laboratory, these affected the light intensity of the therefore making another variable. Also the lamp generated heat that increased the temperature and therefore caused another variable to the experiment. An increase in temperature with high light intensity increases the rate of photosynthesis. Therefore this can cause the results to be unreliable. Measuring the temperature with the thermometer could have been incorrect because the thermometer was placed in different area each time. This would mean that the heat intensity at that given time could have been higher than another part of the lamp. The heat generated by the lamp can cause the enzymes in the Elodea to work faster as the temperature rises as the enzymes are slowly reaching their optimum temperature. Therefore the rate of photosynthesis would increase and the movement of the meniscus would also increase. This therefore shows the results are inaccurate and may explain the sudden increase in movement in the meniscus in the concentrations of 0.0500-mol dm-3 and 0.1000-mol dm-3.
Many faults in my method/ procedure have caused my results to be inaccurate and therefore many more replicates would need to be taken.
Many improvements can be carried out during the procedure to reduce the degree of inaccuracy in the results obtained. A more secure connection between the capillary tube and the nozzle of the syringe can be made. Switching the lamp off before each experiment could would prevent the temperature increasing and therefore the enzymes themselves working faster. When pulling the plunger back ensuring there were no air bubbles or spaces in the barrel or capillary tube. Using a more concentrations of sodium hydrogen carbonate would give a more accurate set of results. And also taking more replicates and repeats would enable me to see if my results are reliable. Using a more convenient apparatus than a clamp and boss to hold the capillary tube and would also make certain that the lamp was 8cm away from the Elodea. Measuring the meniscus with a more accurate instrument than a ruler would give more accurate results.
All these factors should be considered so the experiment can be improved if I was to do a similar or the same experiment again. From the analysis and evaluation it can be seen that limitation and errors with the method have caused the results to be unreliable. However I can also conclude that the results have been successful to a degree as they did show the correct trends and patterns