In this experiment, the pH was kept constant using a pH 7 buffer, selected to maintain a pH level suited to the enzyme by being equal to the natural environment of the enzyme (potato tissue).
-
Substrate Concentration – When there is an excess of enzyme molecules, an increase in the substrate concentration, produces a corresponding increase in the rate of reaction. If there are sufficient substrate molecules to occupy all of the enzymes’ active sites, the rate of reaction is unaffected by further increases in substrate concentration as the enzymes are unable to break down the greater quantity of substrate. To control the substrate concentration, identical quantities of the substrate were used for each reading. To ensure that this was measured precisely, 5ml syringes were used to accurately gauge to exact quantities.
-
Inhibition – Inhibitors compete with the substrate for the active sites of the enzyme (competitive inhibitors) or attach themselves to the enzyme, altering the shape of the active site so that the substrate is unable to occupy it and the enzyme cannot function (non-competitive inhibitors). Inhibitors therefore slow the rate of reaction. They should not have affected this investigation, however, as none were added.
-
Enzyme cofactors – cofactors are none protein substances which influence the functioning of enzymes. They include activators that are essential for the activation of some enzymes. Coenzymes also influence the functioning of enzymes although are not bonded to the enzyme. Unless enzyme cofactors were present in the potato tissue containing the Catalase, they were not included in this investigation and therefore would not have affected the rate of reaction and the results of this experiment.
-
Enzyme Concentration – Provided there is an excess substrate, an increase in enzyme concentration will lead to a corresponding increase in rate of reaction. Where the substrate is in short supply (i.e. it is limiting) an increase in enzyme concentration has no effect. The enzyme concentration was varied by altering the number of equal sized discs of potato that contain the Catalase, in the reaction. The greater the number of discs, the greater the enzyme concentration.
When measuring the volumes of Hydrogen Peroxide, the measurement should be the taken from a 90-degree angle to avoid parallax error.
Apparatus:
- Bung with delivery tube
-
Gas syringe barrel (20cm3)
- Clamp stand
-
Syringe(5cm3)
-
50 cm3 pH 7 buffer
-
Hydrogen Peroxide 50 cm3 (5-25 volume)
- Knife
- Beaker
- Test tubes
- Test tube rack
- Ceramic tile
- Stop clock
- Safety goggles
- Forceps
- Ruler
- Potato
- Cock borer 10mm diameter
Take care with the Hydrogen Peroxide. Wear safety goggles and try to get any on the skin, wash it off immediately if you do.
Method:
- Using the cork borer, cut a cylinder of potato tuber tissue into cm intervals using a knife and plastic ruler. Slice the cylinder into discs 1mm thick.
-
Place the discs into a few cm of pH 7 buffer in a beaker to keep them moist.
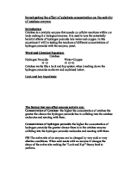
- Assemble the apparatus shown below.
- Take particular care against breakage as you insert the delivery tube into the syringe barrel.
-
Using a test tube as the reaction vessel, place about 10 potato discs into the tube adding 5 cm3 of pH 7 buffer solution.
-
With another syringe, measure 5cm3 of Hydrogen Peroxide (H2O2), carefully loosen the bung of the boiling tube and very quickly and safely add the Hydrogen Peroxide.
- Replace the bung immediately and start the stop clock ensuring that it provides an air tight seal. Tap or shake the tube if necessary to mix the contents.
- Record the volume of oxygen produced every 30 seconds for 3 minutes.
- Repeat the procedure with the other Hydrogen Peroxide solution. Be careful not to contaminate each solution with one another, this will cause inaccurate results.
- Repeat all the tests at least three times so that an average can be obtained. Repeating the experiment several times will help to produce better and more accurate results as any inaccuracies in one experiment should be compensated for by the one experiments.
- Note all the results in a table.
Safety – Laboratory coats were worn during the investigation to prevent chemicals from spoiling clothes. Care was also taken whilst handling the chemicals as hydrogen peroxide is corrosive and the manometer fluid is permanently staining. Whilst using the knife, care was also taken to hold it by the handle and not the blade to prevent an accident occurring.
Results:
All the times are in seconds. The average results are written down to one decimal place because although the stop clock gives results to two decimal places, it is impossible to get accurate times to two decimal places. This was due to the fact that our reaction times are not fast enough to stop the stop clock precisely. The reaction rates were then calculated with the equation:
Rate = 30/ average time
Table showing results obtained from experiment.
From these rates, a graph was plotted to show the rate of reaction against concentration of Hydrogen Peroxide.
Interpretation and Conclusion:
When the concentration of Hydrogen Peroxide is increased, the rate of reaction increases at a directly proportional rate until the concentration of Hydrogen Peroxide reaches about 10 volumes. If the concentration was doubled, then the amount of oxygen released wouldn’t be a figure twice as much.
From 10vol to25vol,thgraph shows a directionally proportional decrease in reactivity rate. After 10vol, the rate of reaction slows down.
At this point, virtually all active sites are occupied making the active sites saturated with Hydrogen Peroxide. With an increase, the concentration of Hydrogen Peroxide, the number of active sites increases, hence, makes a more violent reaction (quicker).
The theoretical maximum rate of reaction is when all the sites are being used but in reality, this theoretical maximum is never reached due to the fact that not all the active sites are being used at the same time. The substrate molecules are being used at the same time to join onto the enzyme and to leave it so the maximum rate achieved is always slightly below the theoretical maximum. The time taken to fit into and leave the active site is the limiting factor in the rate of reaction.
Evaluation:
To enable this experiment to be completed as accurate as possible, it was repeated three times and then an average of all the results was used to plot a graph with a line of best fit. The variables for all the experiments were the same except for the concentration of Hydrogen Peroxide. However, in reality it is impossible to keep all the variables precisely the same for example:
- There was a slight delay between pouring the Hydrogen Peroxide with the potato discs into the test tube of each individual experiment but as all the three steps were carried out in the same way for all the experiments, it should not make any difference to the overall result.
-
It is also impossible to precisely measure out the amounts of Hydrogen Peroxide and pH 7 buffer each time. As the scale on the syringe shows the volume to the nearest mm3, the volumes of the solutions were correct to the nearest mm3.
There were no anomalies found in this experiment.
As using catalase found in potatoes, the desired amount was hard to measure. Measuring the amount of potato wasn’t difficult although the pieces could have contained different amounts of catalase compared to another piece. The results that were shown from both pieces could be negotiable.
The problem of the delay between pouring in the Hydrogen Peroxide, bunging the test tube and starting the stop clock could have been limited by getting another person to start the stop clock when the Hydrogen Peroxide was poured into the tube.