Apparatus list
- Test tubes X 11
-
0.10 molar dm -3 Copper (II) Sulphate solution
- distilled water
- egg albumen from 3 eggs.
- Syringe X 12
- colorimeter
- tripod
- 100ml beaker
- Bunsen burner
- test tube holder
- safety glasses
- gloves
- test tube pen
- test tube
method
Before conducting the experiment I would conduct a simple test for the protein by placing a sample of the albumen into a test tube and add biurett reagent. This contains copper (II) sulphate and sodium hydroxide. If upon addition the sample turns from clear to milky then the protein is present and the albumen is not faulty.
-
firstly a serial dilution of the 0.10 moldm -3 sucrose solution must be conducted to produce the following concentrations of copper (II) sulphate solution. The concentrations required are; 0.10m, 0.09m, 0.08m, 0.07m, 0.06m, 0.05m, 0.04m, 0.03m, 0.02m, 0.01m, 0.00 molar. Refer to serial dilution table below:
fig 1: serial dilution table
-
10 Cm3 of the solutions above must be placed in a separate test tube using a Syringe. Care must be taken to ensure a separate Syringe in used for each concentration of copper solution. To avoid contamination. Also that exactly 10cm3 of the solution is added, to a clean and dry test tube to ensure a fair test.
- Record the concentration of the solution on test tube using test tube pen.
- Place a sample of the solutions above into the colorimeter and record the % on table 2 place the solution back into the corresponding test tube.
-
Set up a water-bath using a Bunsen burner and use warm tap water, the temperature must be maintained at 25oc checking from the thermometer and Bunsen burner to maintain it.
-
Add exactly 2cm3 of the egg albumen from the same into each test tube using a syringe.
- Evenly mix the solution for 3 minutes and leave to rest for another 6 minutes, after this mix again for 1 minute. Mix each test tube with the same force.
- Place the solution into the colorimeter and record the result on table 2
- Repeat procedures 6-9 for each of the concentrations and then repeat each procedure 1-9 three times to obtain more accurate results and place results on table 2.
Results
Fig 2: results table
Once all the data has been collected it can be analysed. I make the information more easily readable with the use of a table of averages.
Fig 3: table of averages
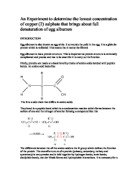
From this information I will make a graph, I have incorporated my prediction on the graph.
Fig 4: graphical representation of the data.
From the graph the lowest concentration of the copper (II) Sulphate can be seen when a substantial change in colour occurs, my prediction is that the lowest concentration is between 0.02 and 0.03 mol.
Discussion
Safety assessment: during this experiment safety gloves and glasses should be worn at all times, the reason for this is that as copper (II) is able to denature proteins if it comes into contact with the skin or eyes it can cause irritation. There should also be no naked flames within the area as sodium hydroxide is extremely flammable.
Factors to control: the albumen is denatured by heat other chemicals, and therefore the room temperature should remain constant by keeping all windows closed. Also all apparatus must be cleaned and dried before use.
Evaluation
For the experiment to be conducted fairly a control must be set up, in this case the control is the 0.00 solution which is distilled water.
Also for the experiment to be accurate the sample after serial dilution must be placed within into the colorimeter as the copper (II) sulphate originally is a blue colour. The use of the colorimeter makes this experiment more accurate as it quantifies the results.
To make it more accurate more concentrations could have been tested eg, gap between every 0.05mol. also more repetition of the experiment and the average used could have been calculated to reduce the effect of any anomalous results.
For each round of conducting the experiment egg albumen should be taken from a different egg and within each stage the same egg should be used therefore a total of three eggs and each egg at each concentration used only once. This reduces the chance of an anomalous result.
The limitations of the experiment include no machinery to automatically mix the solutions in the test tube, this would increase the accuracy as there is a chance for human error. Also more specialised equipment to measure volumes to a greater accuracy.
This experiment could also be quantified by weighing the precipitate using scales. Records could be made of each concentrations precipitate using a filter funnel and a second graph could also be discussed.
Appendix
Albumen information
Also known as egg white, Albumen accounts for most of an egg's liquid weight, about 67%. It contains more than half the egg's total protein, niacin, riboflavin, chlorine, magnesium, potassium, sodium and sulphur. The albumen consists of 4 alternating layers of thick and thin consistencies. From the yolk outward, they are designated as the inner thick or chalaziferous white, the inner thin white, the outer thick white and the outer thin white. Egg white tends to thin out as an egg ages because its protein changes in character. The cloudy appearance comes from carbon dioxide. As the egg ages, carbon dioxide escapes, so the albumen of older eggs is more transparent than that of fresher eggs. This is very important for this experiment as it shows the need for the experiment to be conducted several time and averages obtained. This reduces the effect of the eggs age and character of the albumen.
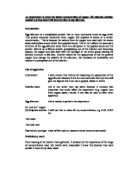
The peptide bond
The illustration below is of example of the peptide bond present within the albumen. The NH3 group is the group which is effected by the heavy metal copper. The copper (II) ions are highly electropositive. They combine with COO- groups and disrupt ionic bonds. This also denatures the protein.
Sources
1: biology text book: ‘Biology’ –Martin Rowland
2: class notes: food test experiments: biurett test
3: internet :
http://www.georgiaeggs.org/pages/albumen.html’
Information obtained from biology rowland book, ref source 1.
The prepaority test was obtained from previous class work ‘food tests.’
Information obtained from ‘http://www.georgiaeggs.org/pages/albumen.html’
diagram taken from http://faculty.clintoncc.suny.edu/faculty/Michael.Gregory/