Dilutions: (all dilutions made for 50ml)
- 1 molar sugar solution = 50ml sugar solution
- 0.2 molar solution = 10ml sugar solution + 40ml pure water
- 0.4 molar solution = 20ml sugar solution + 30ml pure water
- 0.6 molar solution = 30ml sugar solution + 20ml pure water
- 0.8 molar solution = 40ml sugar solution + 10ml pure water
- 0.0 molar solution = 50ml pure water
Risk Assessment:
- Wear goggles.
- Tie longhair back
- Be careful that you do not cut yourself with the knife.
- Do not run around the science laboratory if you have a knife in your hand.
- Do not drink any solution used in any of the experiments.
Fair Test:
To create a fair test certain aspects of the experiment will have to be kept the same whilst one key variable is changed. I have chosen to vary the concentration of the sugar solution. This will give me a vary varied set of results from which I hope to make a decent conclusion. If any of the non-variables below are not kept constant it would mean it would not be a fair test.
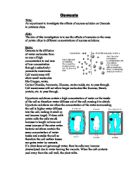
When putting any type of cell into a liquid, there are three possible outcomes:
- Keep the amount of solution in each beaker the same (50ml), this I because if there is a different amount of solution in the beaker you will not get accurate results as the environment is not controlled. It is important that all environment are kept the same throughout the experiments, this will slim down the chances of error.
- Leave the potato in the solution for the same length of time (25 min), you do this so that all have and equal amount of time in the substance, so it is controlled.
- Use the same scales for each weighing. You do this so if the scale it faulty all your results will be fair as they would all be heavier by how ever many grams it is.
Prediction:
For this trial experiment I think that none of the potatoes will change in there mass, this is due to the rule of osmosis. As explained earlier osmosis is the diffusion of water from a region of high water concentration through a semi-permeable membrane to a region of low water concentration.
The rate that it passes depends on pressure, concentration and temperature of the molecules or solutes on either side. If the solution is a sugar solution then the mass of the potatoes will decrease.
Plant cells always have a strong cell wall surrounding them. When they take up water by osmosis they start to swell, but the cell wall prevents them from bursting. Plant cells become turgid when they are put in dilute solutions. Turgid means swollen and hard. The pressure inside the cell rises and eventually the internal pressure of the cell is so high that no more water can enter the cell. This liquid or hydrostatic pressure works against osmosis. Turgidity is very important to plants because this is what makes the green parts of the plant stand up into the sunlight.
When plant cells are placed in concentrated sugar solutions they lose water by osmosis and they become "flaccid." This is the exact opposite of "turgid". The contents of the potato cells shrinks and pulls away from the cell wall. These cells are said to be plasmolysed.
When plant cells are placed in a solution which has exactly the same osmotic strength as the cells they are in a state between turgidity and flaccidity. We call this incipient plasmolysis. This is because the water inside the sugar can escape through a semi-permeable membrane, as the size of the molecules is small enough to go through, so as semi permeable membranes allow small molecules through, the sugar molecules is too big and will not be able to go through. So the water molecules will be going out of the potato chips but the solutions surrounding it will not replace it so the mass of the potato will decrease. I think that the higher the concentration gets the more the potato will decrease in its mass. Whereas, at low concentration there would be an increase in mass as the water potential of the surrounding solution would be higher than of the potato chip which will cause the potato chip to gain weight
Trial experiment:
Observations:
- Potato length – 5cm
- The potato in the pure water sinks.
- Potato cutter is 6mm in diameter.
- Room temperature – 23 degrees
- Solution temperature – 19 degrees
- The potato in the sugar solution floats.
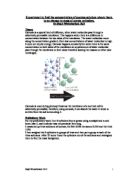
We will leave the potato for 25 minutes in a beaker; however, because it is only the trial experiment, we will be only trying the 1 molar sugar solutions and the 0.0 molar-pure water solutions.
Results:
Conclusion: The potato in the sugar solution has gone down by 0.2 grams in weight and the potato in the pure water; the weight has gained by 0.2 grams..
From the results I have found out my predictions was correct, that the potato in pure water has stayed the same whereas the in the sugar solution the mass had decreased by 0.2 grams.
Evaluation:
- The small test tube was too small; therefore, we will be using a test tube.
- We don’t need to change the volume of solution, because the test tube will be enlarged for the real experiment. This means we will stick with the current dilutions.
- We didn’t have enough time to finish off the experiment with in the lesson, so we are going to reduce time to 20 minutes, so that we can prepare for the experiment and also have enough time to clean up after the experiment.
Real experiment number one:
Method:
This method has been changed and improved from the preliminary experiment.
- Take a potato.
- Then using the corker to cut a cylinder potato shape out. The corker’s circular head should have a diameter of 6mm. It should come out as a long cylinder, and then cut it again using a knife so it is 5cm long. Repeat this step until you have 6 individual pieces.
- Then weigh it to see its mass, record this amount in a results table. The results will be recorded to two decimal places.
- Place 1 of the potato pieces into a test tube than contains 25ml of pure water (0.0 molar). Leave for 30 minutes.
- Take it out of the solution and pat dry again. Then weigh the potato again to record its new mass on your results table.
- Know take the other beakers and fill them with 25ml sugar solution that has been diluted from 1 molar. (dilutions listed below) One containing 0.2 molar, one containing 0.4 molar, one containing 0.6 molar, one containing 0.8 molar and finally one containing the original 1.0 molar.
- Once again pat each potato dry, weigh it and record its mass before putting into the beakers.
- Leave all for 25 minutes. Then take out of beakers pat dry and weigh again for new mass results.
- Make sure you record all results in a results table clearly.
Variables to control are:
Room temperature- this could speed up the reaction. An increase in temperature would cause the molecules to move faster and this would react the reaction as it would make it faster, whereas a decrease in temperature would slow down the reaction as it would slow down the movement of the molecules.
Time- time will be kept the same so that the time for osmosis to take place is the same for each concentration.
Size of potato- surface area would affect the rate of osmosis so having the same area would make sure that I can get fairer results.
Volume of solution and concentration of solution- to get fairer results the amount of solution will be kept the same using a measuring cylinder.
To create a fair test certain aspects of the experiment will have to be kept the same whilst one key variable is changed. I have chosen to vary the concentration of the sugar solution. This will give me a vary varied set of results from which I hope to make a decent conclusion. If any of the non-variables below are not kept constant it would mean it would not be a fair test. For the purpose of my experiment I am going to do all the experiments at room temperature.
To keep the water potential of the potato initially will be kept the same by using the same type of potato, which have been treated in the same way, e.g. have all been cut without being washed and peeled.
The mass of the potato is a dependent variable, and this means that it will be measured
throughout the experiment. I will measure the mass in grams. The potato chip will be
measured before it is put in the solution, and after. This will allow us to see whether
osmosis has taken place, and to what extent.
The volume of the solution that the potato chips are kept in must be fair. The must be
totally covered in the solution, and the amount of solution will be kept the same because
all the potato chips are the same size.
I am also going to use the same balance to weigh my potato chips. This is because the measurements may slightly vary between scales.
Real experiment 1:
Apparatus List:
- Distilled water- this will make the results more accurate as it wouldn’t contain any minerals, so it wouldn’t affect the potato chips.
- Potato cutter- this is to cut the potato so that they all are the same length
- 6 x 250ml test tube- this is where the potato will be kept in and also osmosis will take place in.
- Potato
- Scale- to measure the mass of the potato chips.
- Sugar solution for 0.2, 0.4, 0.6, 0.8 and 1.0 molars.
- Stopwatch- to time the experiment.
- Knife- to cut the potato chips to the right length.
- Scalpel- to remove the skin of the potato easily.
- 1 molar sugar solution
- Ruler- to measure the length of the potato chip.
- Paper towels- so that the potato can be dried making sure that the mass is not affected.
- Goggles- to protect the eyes.
- Tile- so that the potato can be cut on a hard surface.
New Dilutions: (all dilutions made for 25ml)
Observations:
- Potato weight – 2.15 grams
- Room temperature – 23 degrees
- Sugar solution – 15 degrees
- All of the potatoes in the sugar solutions are floating.
- The potato in the pure water sinks.
Results:
Real experiment 2:
New Dilutions: (all dilutions made for 25ml)
- 1 molar sugar solution = 25ml sugar solution
- 0.2 molar solution = 5ml sugar solution + 20ml pure water
- 0.4 molar solution = 10ml sugar solution + 15ml pure water
- 0.6 molar solution = 15ml sugar solution + 10ml pure water
- 0.8 molar solution = 20ml sugar solution + 5ml pure water
- 0.0 molar solution = 25ml pure water
Observations:
- Room temperature – 23 degrees
- Sugar solution – 20 degrees
- All of the potatoes in the sugar solutions are floating.
- The potato in the pure water sinks.
Results:
Real experiment 3:
New Dilutions: (all dilutions made for 25ml)
- 1 molar sugar solution = 25ml sugar solution
- 0.2molar solution=5ml sugar solution +20ml pure water
- 0.4molar solution=10ml sugar solution+15ml pure water
- 0.6molar solution=15ml sugar solution+10ml pure water
- 0.8molar solution=20ml sugar solution+ 5ml pure water
- 0.0 molar solution = 25ml pure water
Observations:
- Room temperature – 23 degrees
- Sugar solution – 10 degrees
- All of the potatoes in the sugar solutions are floating.
- The potato in the pure water sinks.
Results:
Overall Results:
A result table below shows the average potato weight difference after experiments
The above results have some very strange results within them, these are highlighted in red as shown.
Conclusion: In conclusion the experiments ran very smoothly and I think my results follow the theory of osmosis. My prediction was correct, when the concentration of sucrose increases there is a decrease on the potato’s weight.
This graph shown above gives the line of best fit for the percentage change in mass of the potato chips over the course of the thirty minute experiment. The graph is a curve that slopes downwards and does not go through the origin. Because the line is not straight and does not pass through the origin, it means that the percentage gain and loss in mass and concentration are not directly proportional. However, there is a pattern on my graph, and this is, as the concentration of the solution increases, the percentage change in mass decreases. The graph shows that the percentage gain and loss in inversely proportional to the concentration. The gradient does change in my graph. It gets less steep as X axis gets bigger. This is because the potato chip is becoming as flaccid as it possibly can, and so the change in mass of each molar concentration is becoming closer and closer together. From the line of best fit that has been added in, it can be seen that all of my points were very close to creating a perfectly smooth curve. This shows that my results are fairly reliable. My graph fits in with my prediction of the experiment graph.
It shows that the potato cells increase in mass in solutions with a high water concentration and decrease in mass in solutions with a low water concentration. When the concentration reaches above 0.75 M, there appears to be no further water loss, suggesting that the cell is fully plasmolysed. From the graph an estimate to the concentration of the potato cell can be made as 0.13 M, as this is the point where the potato is not increasing or decreasing in mass, this is known as the isotonic point. This is where no osmosis is taking place, both the potato and the solution have an identical molar concentration. The next point, 0.25 M looses approximately 4.0 %. This shows that the water potential of the salt solution in the beaker is weaker than that of the potato chip. The next, 0.50 M, looses approximately 8.0 % in mass. This shows that the salt solution has an even weaker water potential than 0.25 M and that osmosis took place. This is why the potato lost even more mass, and it shows that the water potential in the beaker is less than that of the potato chip. This pattern carries on through the graph, and even more mass is lost, as more water moves out of the potato into the solution. My results also match with my initial predictions.
EDIT THIS ABOVE
This graph of the change in mass helps prove the point of complete plasmolysis, whereby the potato cannot expand and take in any more water. As you can see as the molar concentration increases the change in mass decreases. From left to right the first two points on the graph are very spread out indicating that there was a large change in the mass. This decreases throughout the increasing molar concentration until the change is minuscule (about 0.02g).
This graph above shows a clear indication that there was an overall decrease in mass during the experiment. At the point 0.00 M the line for after the experiment is above the line for before the experiment unlike any of the others. This is because the water potential of the sugar solution is higher than that of the potato chip.
Problem suffered during experiments; The experiment was very successful in my opinion because it enabled me to get accurate results which made me able to get a line of best fit. In my graph there was only one set of results which was unexplainable.
In experiment three I discovered that there was an anomalous result. This is shown on the graph above, the large red spot indicates the location of that anomalous result. There are a few possible reasons why this could have occurred could be because:
- The potato could be left on the tissue for too long, leaving it for too long could cause the potato to absorb the excess solution on the surface.
- The freshness of the potato could be another factor as one potato could be new and another old.
- Also as the drying up of the potato cause the mass to be changed. After the experiment I left them on a paper towel, when I removed them off the paper towel and onto the scales. I noticed wet patches left on the paper towel where the potato pieces had been left. The 0.8M potato piece was one of the last pieces to be weighed, therefore it loss a bit of water. This may be due to the extremely low weight of the potato piece.
- Temperature of the experiment could have had been changed causing the reaction to either slow down or react faster. The door connecting the classroom to the outdoors was opened during the intercourse of the lesson, to cool down the classroom.
- Human errors- reading the changes, or adding different amount of solutions. I feel this is possible for I was in a rush to gather the information to leave lesson.
There is a bight blue line on the graph, this shows the trend of the result on experiment one and two. Both experiments have had a constant decrease of mass when the concentration of sucrose has increased. In experiment one and two, I was quickest at recording the results for the scales were free and nearer to my workplace. On experiment three the scale were being used by someone else, also there was a queue of two people behind him. This delayed me, and therefore the paper towel soaked a lot more water from the potatoes than if I was able to use the scales straight away.
Next time to overcome the problem:
- Potato left for too long- each of the potato should be left for a specific amount of time after the experiment has taken place.
- Freshness of potato- buy potatoes on the same day so that the freshness is also the same.
- Drying of potato- each of the potato should be left for a specific amount of time after the experiment has taken place.
- Temperature- uses a water bath so that the temperature is the same.
- Human errors- this can not be prevented but give a lot of attention making sure that the results are correct.
I obtained a large quantity of accurate results from which I was able to create accurate graphs. HOW I think I took easily enough results for the amount of concentrations that I was using, and the time that I used for the experiment to last was enough to allow sufficient osmosis to occur. However if I was to repeat the experiment I might well increase the time of the result to allow more osmosis to happen and possibly find out the saturation point of the chips. The range of concentrations was adequate but I would possibly create more concentrations if I repeated the experiment so that I would have more varied results, i.e. 0.1m, 1.5m, 0.7m, and so on.
I also could have found a more accurate way to measure out the solutions and to determine the molar concentrations. Perhaps I could have used a burette. This would ensure that I have an accurate amount of fluid in each test tube. I could also weigh each chip on a more accurate scale, e.g. not to 0.00g but to 0.0000g.
There were not any out of the ordinary results, but some were not as close to the line as others. This may have been caused by human error. When the potato chips were removed from the test tubes and dried I may well have dried some potatoes more thoroughly than others and so some would have more excess water, which would add to the mass. If the experiment was repeated I could find another way to dry the potatoes that would ensure that all were dried in the same way for the same time. However with all this said I think that the experiment was truly successful and I was very pleased with the complete comparison of my results with my initial prediction.
Skill Area E: Evaluation
The experiment was very successful in my opinion. I obtained a large quantity of very accurate results from which I was able to create informative graphs. I think I took easily enough results for the amount of concentrations that I was using, and the time that I used for the experiment to last was enough to allow sufficient osmosis to occur. However if I was to repeat the experiment I might well increase the time of the result to allow more osmosis to happen and possibly find out the saturation point of the chips. The range of concentrations was adequate but I would possibly create more concentrations if I repeated the experiment so that I would have more varied results, i.e. 0.10m, 1.15m, 1.20m, and so on. This way would have allowed me to also find out the isotonic point far more accurately as the one that I estimated is very approximate.
The cutting of the potatoes was the most difficult part of the experiment as although I was recording my results by mass, it could well have affected the surface area and so the overall rate of osmosis. If I were to repeat the experiment I would have possibly found a machine to cut the potato as it would ensure that all potatoes would be the same weight and dimensions. As well as the potato I could have found a more accurate way to measure out the solutions and to determine the molar concentrations. Perhaps I could have used a burette. This would ensure that I have an accurate amount of fluid in each test tube. I could also weigh each chip on a more accurate scale, e.g. not to 0.00g but to 0.0000g.
There were not any out of the ordinary results, but some were not as close to the line as others. This may have been caused by human. When the potato chips were removed from the test tubes and dried I may well have dried some potatoes more thoroughly than others and so some would have more excess water, which would add to the mass. If the experiment was repeated I could find another way to dry the potatoes that would ensure that all were dried in the same way for the same time. However with all this said I think that the experiment was truly successful and I was very pleased with the complete comparison of my results with my initial prediction.