Apparatus list:
- 5 × specimen jars.
- Different concentrations of sugar solutions.
-
Distilled H2O.
- Potatoes.
- Ruler
- China graph pencil.
- Weighing balance
- Knife/scalpel
- White tile.
- Paper towels.
- Elastic band.
- Measuring cylinder.
Method:
- We first took a potato, cut it in half using a knife, and then cut out five rectangular potato chips from it.
- We cut each of the potato chips to 4cms, and weighed each of them using a weighing balance. The masses of all five chips were recorded.
- We put the five chips into five specimen jars and labelled them with their correct solution.
- We then made various solutions to add the to potato chips.
- In each of the specimen jars, containing their potato chips, 15ml of distilled water, 20% sugar solution, 40% sugar solution, 60% sugar solution and 80% sugar solution, were poured. All of the specimen jars were kept together using an elastic band and were left by the window over night.
- In the next lesson, we took out all of the chips from their solutions, dried them, re-weighed them and re-measured them. We then recorded all of our new results.
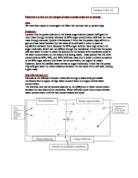
Making the solutions:
Diagram:
Factors/Variables:
Factors that are involved in osmosis are….
- Temperature
- Size of potato
- Light intensity
- Volume of solution potato chip is in
- Type of potato
- Time left in solution
- Surface area of potato chip
- My independent variable = Concentration of sugar solution.
- My controlled variables = light intensity, type of potato, time left in solution and temperatures.
- My dependant variables = New length of potato chips and new mass of potato chips.
Fair testing:
To complete this experiment fairly, we are only allowed to change one variable. This means that all other factors will have to be controlled.
- We must use potato chips of the same length to keep the surface area the same.
- We must try and keep the temperature the same. (Do all the experiments at room temperature).
- We must use the same potato each time, because different potatoes may absorb at different rates.
- The light intensity should be kept constant.
- The only variables that can change are the sugar solutions.
- We must keep the potatoes in their solutions for the same lengths of time.
- We must use the same balance to measure all of the chips.
- We must try to keep the chips in the same volumes of solution.
- We must put all of the chips into their solutions at the same time.
- We must be careful not to squeeze the chips when taking them out of their solutions.
Reliability:
To ensure reliability, I have used another group’s results.
Safety:
- All of the test tubes will be kept in a test tube holder so that they won’t drop over as easily.
- All of the potatoes will be cut on a white tile to reduce the risk of anybody getting cut.
- Be careful when carrying a knife around the laboratory.
- Be careful when using the knife, as it could slip and injure you.
- Wash your hands after the experiment.
My results:
Another group’s results:
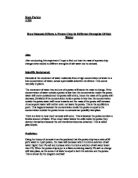
Graph of my results:
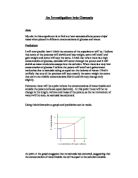
Graph of other group’s results.
Analysis:
Using the results from my table, I made a graph to show what had been found out from the experiment.
My graph to show the masses of potato chips after the experiment forms a downward sloping line of best fit. This means that as the concentration increases, the mass of the potato chip decreases. This is due to water leaving the potato chip in order to create a balance between the concentration of water on the inside of the potato and the concentration on the outside of the potato. The amount of water lost from the potato depends on the concentration of sugar solution. The higher the concentration, the more water that the potato tries to release through osmosis to gain a balance.
My graph to show the length of potato chips also forms a downward sloping line of best fit. This means that as the concentration increases, the length of the potato chip decreases. This shows that water has left the potato in high concentrations, causing it to shrink.
To improve the reliability of our results I have used another group’s results. This has also provided me with more variables, as the other group has used less sugar/water volumes and have used potato chips with smaller lengths. Both of their graphs have downward sloping lines of best fit. This show that the length of the potato and the volumes of solutions they are in do not affect osmosis in any way.
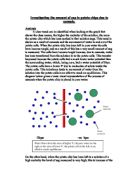
When the potato chips were taken out of their solutions, the lower the concentration, the more turgid the chip was. This is because in lower solutions, the potato chip is gaining water to try to make the water concentrations on both sides of the cell wall the same, meaning that the plant cells swell up until no more water can get into them. This makes them hard and less floppy. The opposite procedure happens to cells in strong sugar solutions, as they lose water to gain a balance, making the chip flaccid.
When comparing my preliminary results to the results in the recent experiment, I found that they follow the same pattern. This means that the higher the concentration is, the greater the loss in mass is.
My results prove that my prediction was correct since I said that the higher the concentration, the greater the mass lost.
Evaluation:
The experiment went very well, since we were able to obtain all of the results that we needed, once, in the given time limit. This meant that we were able to produce a graph based on our findings. I think that the method was quite good; however, it does not say to repeat results, meaning that there is no way of proving our findings.
Although we didn’t repeat results, we did take results from another group, giving some reliability to our results.
Looking at my graph to show the mass of each potato chip after the experiment, I can see 3 anomalous results, which do not lie on the line of best fit. However, since they lie close to the line of best fit, they show that the results we obtained were quite accurate. Looking at my graph to show the lengths of the potato chips, I can see 1 anomalous result. Likewise, this result lies close to the line of best fit, meaning that the results are quite accurate. Anomalous results could have occurred do to us not repeating results, which could have given us a better average, and thus produced a better graph.
Another reason that anomalous results may have occurred is that there was a mistake while mixing the concentrations due to human error when pouring in solutions. Also, the potato chips may have been measured incorrectly, again due to human error.
If I was to do this experiment again, there are a number of things that I would have done differently. For example, I would have used a potato borer to cut the potato to make sure that all of the chips were the same shape, and thus easier to cut into the lengths that we wanted. More variables could have been used to make the experiment more interesting and educational.
Another experiment that we could do to test osmosis is to take some visking tubing, knot it and half fill with starch solution, half fill with glucose solution. Then put it in a test tube full of water. Leave this for a while, then test the water for starch using iodine solution and test inside the visking tubing for glucose using benedict’s solution.