The tables can be used to construct a graph which can be used the average water potential of cells at equilibrium.
Potato cells tend to have a higher water potential than many plant cells. This is because they store starch, which is insoluble and, therefore, does not lower water potential. Apple cells, which store sugar, have a lower water potential because sugar is soluble.
Pilots:
I carried out a pilot to decide whether to use petri dishes or boiling tubes and which size of potato/apple tissue to use.
I discovered that boiling tubes gave the best results with more definite increases and decreases in mass. Boiling tubes mean that a higher percentage of the apple/potato tissue is immersed in the solution.
I also discovered that using a size 4 cork borer also gave the most definite results and had a good volume to surface area ratio, meaning that there was enough time for the cells to complete osmosis.
Apparatus:
12 boiling tubes – boiling tubes gave the best results in the pilots.
Size 4 cork borer – gave the best results in the pilots
Knife – to cut off skin
Cutting tile –to cut the potato and apple pieces on.
Apple
Potato
2 syringes – for measuring amounts of water and sucrose.
6 Beakers – to make up solutions in.
90cm³ Distilled water
90cm³ Sucrose
Test tube rack – to keep boiling tubes upright.
Paper towels – to blot of excess solution and keep pieces moist.
Balance – to 2 d.p.
Method:
Make 60cm³of 6 different concentrations of sucrose solution, 0, 0.2, 0.4, 0.6, 0.8, 1 M.
Divide each concentration between 2 boiling tubes so there is 30cm³ in each
Using a Cork Borer, cut 12 equal sized pieces of potato making sure all skin is removed.
Using a Cork Borer, cut 12 equal sized pieces of apple making sure all skin is removed and they are the same size as the potato pieces.
Weight the potato and apple pieces and record mass.
Put 2 potato pieces in each different solution.
Put 2 apple pieces in each different solution.
Leave for 3hrs.
Remove potato pieces from solution and weigh.
Blot dry and reweigh.
Record new mass.
Repeat weighing process for apple pieces.
Work out mean % change in mass using;
Mean % change = Mean Change in mass (g)
Mean Original mass (g)
Safety Precautions:
Wear goggle when cutting potato as potato juice is and irritant. Take care when using sharp knife and cork borer.
Variables:
The key variable is the concentration of sucrose solution. The controlled variables are the size of the potato and apple pieces and the length of time they are left in the solution. This will make the experiment a fair test.
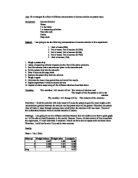
Results:
Table to show mean % changes in mass of potato pieces in different concentrations of sucrose solution.
Table to show mean % changes in mass of apple pieces in different concentrations of sucrose solution.
Mean Values
Potato; 18.02 + 8.09 + (-0.57) + (-8.83) + (-19.48) + (-27.64)
6
= -5.03
Apple; 4.00 + 1.00 + (-1.70) + (-5.8)
4
= -0.625
Conclusion:
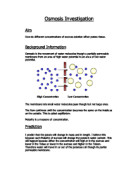
Graph 1 shows us that between 0 and 0.2M solutions the potato pieces gained mass. This is because water is entering the cells by osmosis. Between 0.4 and 1M the potato pieces lost mass, this is because the potato pieces lost water by osmosis. Graph 1 also shows that between 0 and 0.4M the apple pieces gained mass because of a net uptake of water. Between 0.6 and 1M the apple pieces lost mass, this is because there was a net loss of water by osmosis. Osmosis is the movement of water from a high X to a lower one through a partially permeable membrane. In osmosis in plant cells the tonoplast and plasma membrane form a partially permeable membrane that allows water through but not sucrose.
In Plant cells X=Xs+Xp
The more dilute the solution the more water taken up by the cell by osmosis. This is because more water is needed to reach the equilibrium, the increased pressure in the cell causes it to become more rigid.
In the solutions with the higher concentrations the cell needs to lose water for the X to be in equilibrium, because the cell loses water the pressure drops making the cells flaccid. Graph 1 also shows that the concentration when the potato and apples cells will not gain or lose water. This is the point at which the line of best fit crosses the x-axis. For potato this is 0.39M and for apples this is 0.5M.
Graph 2 shows us that the mean water potential of potato tissue is
–1050kPa and the mean water potential of apple tissue is –1440kPa.
This is found using the point of equilibrium on Graph 1 and then reading off the values from graph 2 plotted from results in Biological Sciences Textbook.
Evaluation:
I think the experiment was fairly accurate and came out with the expected results, which produced a good line of best fit on my graph and meant the mean water potential of potato tissue could be estimated.
All the results could be explained by osmosis with the lower concentrations gaining mass and the higher concentrations losing mass. (See above).
The plan was a good plan, which worked. Using replicates gave more accurate results and minimised errors. The range of dilutions worked well as the mean water potential was between them. Using a smaller range and smaller intervals would mean a more accurate line of best fit. Using sucrose works well as it is a substance that is naturally found in potato and apple tissue.
Doing the experiment again would, I think, give similar results if I followed the same method. The accuracy of the measuring instruments was sufficient although accuracy could be improved by, using a more accurate balance so potato and apple pieces can weigh exactly the same. Using a different method of transferring the sucrose and water into the boiling tubes as using the syringes resulted in some liquid being lost and also the syringe was not very accurate for measuring amounts. We cannot tell whether the osmosis was completely finished, this could be found out by running some extra pilot experiments with the potato and apple pieces left in the sucrose solution for different lengths of time, but because all the potato and apple pieces were left in for the same amount of time none had a chance to gain or lose more water than the others.
All the potato and apple pieces were left in the same place in the same conditions so there would be no big difference in temperature, however the sucrose solution was at about 4ºC and the water was at around 22ºC. This would mean that the more dilute concentrations would be warmer than those of a higher concentration and this would affect the rate of osmosis. To combat this both the water and the sucrose solution should be left in the same place for a certain amount of time before undertaking the experiment to ensure that both are of a similar temperature.
Most of the replicates were fairly close in results. Any inaccuracies could have occurred when blotting the potato pieces after removing them from the solutions. If a potato or apple piece had any solution left on it, it would affect its final weight, giving an untrue result. More care should be taken when blotting the potato pieces to ensure accurate results. Also pressing too hard when blotting could cause damage to the cells which, again, would effect their final weight. Any other inconsistencies in results could be explained by each potato or apple piece being made up of different quantities of different potato or apple tissue. Different cells would have different rates of osmosis and some may still be taking up/losing water when they are removed from the solutions. This would also give untrue final weights. Also in the boiling tubes, in the higher concentration the potato pieces will float, meaning that there is less surface area in contact with solution. This will affect the time taken to reach equilibrium, as there is less surface area for water to go in/out of the cells.
Averaging the results and turning them into percentages also reduces accuracy as if one of the results is wrong it gets combined with the right one to give an overall inaccurate answer.
There are no obviously anomalous results for the potato. The apple, however, had two anomalous results (labelled on the graph) at 0M and at 1M. The 1M result could be explained by; because it had the biggest change in mass it did not have enough time to complete osmosis thus giving an inaccurate result. If repeating the experiment, the potato pieces should be left for longer in order for the 1M solution to complete osmosis. The 0M could be explained by the same reasons, but I still would have expected a positive result. The reason for this could also be that some of the outer cells were damaged when they were being cut, making them weaker and more likely to burst, even with their cell wall. If the outer cells burst it would mean they couldn’t take up as much water as they should thus reducing the final mass.
Bibliography:
Biological Sciences 1&2 R. Soper (pg 479)
Biology 1 textbook
Class Handouts
Britannica Encyclopaedia Bk 25 Pg 218