Experiment to find the effect of temperature on rates of reaction
CHEMISTRY G.C.S.E COURSEWORK
Experiment to find the effect of temperature on rates of reaction
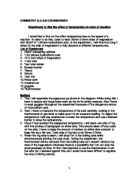
I would like to find out the effect temperature has on the speed of a reaction. In order to do this, I plan to react 20mm X 5mm strips of magnesium with 20cm³ of 1.5Molar hydrochloric acid. In the experiment, I will time how long it takes for the strip of magnesium to fully dissolve at different temperatures.
List of Equipment
. 20cm³ measuring cylinder
2. 1.5M diluted hydrochloric acid
3. 10 X 2cm strips of magnesium
4. 1 test tube
5. Test tube holder
6. Bunsen burner
7. Tripod
8. Gauze
9. Heat mat
0. Water bath
1. Crushed ice
2. goggles
3. Thermometer
Method
. First I will assemble the apparatus as shown in the diagram. While doing this I have to secure any loose items such as my tie for safety reasons. Also I have to wear goggles throughout the experiment because of the dangerous nature of Hydrochloric acid.
2. Next, I have to measure the temperature of the acid carefully, looking at the thermometer at eye level to make sure it is an accurate reading. To adjust the temperature I will use crushed ice to lower the temperature and use a Bunsen burner to raise the temperature.
3. Once it has reached the designated temperature, I will clean one strip of Mg with five strokes of sandpaper on either side. This should clean off any oxide on the strip. I have to keep the amount of strokes on either side constant to keep this as a fair test. Each strip of Mg has to be 20mm X 5mm.
4. When the Mg strip is clean, I will drop it in to the boiling tube while simultaneously starting the stop clock. During the experiment, the thermometer will be removed from the boiling tube so it doesn't obstruct my view of the magnesium otherwise there is a possibility that I do not stop the clock precisely on time. At first I had planned to use the thermometer to stir the acid, but I decided against this, as it would have been difficult to regulate the rate of stirring exactly.
5. Once the Mg has fully dissolved, ...
This is a preview of the whole essay
4. When the Mg strip is clean, I will drop it in to the boiling tube while simultaneously starting the stop clock. During the experiment, the thermometer will be removed from the boiling tube so it doesn't obstruct my view of the magnesium otherwise there is a possibility that I do not stop the clock precisely on time. At first I had planned to use the thermometer to stir the acid, but I decided against this, as it would have been difficult to regulate the rate of stirring exactly.
5. Once the Mg has fully dissolved, I will stop the clock, and record the time into my table.
6. I will repeat the experiment three times at each temperature so that I can regulate and make my results more accurate. This will also help me make sure that my results are correct, since if I only did each experiment once I may make a mistake in the experiment and not realise simply from looking at the results. I will continue the experiment with a range of temperatures from 0oc- 50oc
7. Once all of the results have been obtained and recorded into the table, they have to be carefully analyzed and checked through for any anomalies. If there were any irregular results the experiment for that particular experiment would have to be repeated, until it fits into the general pattern of the experiment.
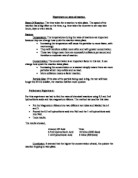
From what I have already learnt and from a previous experiment, I predict that the higher the temperature is, the faster the experiment will be. I also predict the graph will look like this:
I predict this, because for particles to react they have to have a certain activation energy in order for the particles to collide successfully and the bonds to break. This is linked with the collision theory that states that for a successful reaction the particles must collide with enough energy (activation energy) to break bonds and that the collision must be of the correct orientation and not just glancing. By creating a rise in temperature, you are increasing the speed of the particles. And so the particles are moving around faster, and so are more likely to collide on target and with enough energy. It has been proved that a simple 100C rise in temperature changes the speed of the particles and raises the amount of particles that have the necessary activation energy, as shown in this Bolzman distribution curve.
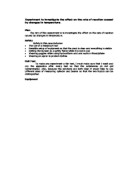
There are a couple of reasons this experiment may not achieve the results I expect. First, if the experiment is not kept in a constant environment, should the room in which it is kept is warm one day, and cold the next time I do the experiment it could affect the results. Within the experiment itself, even minute alterations in the length of Mg or the temperature of the HCl could have a large impact on the results. Both of these reasons mean that the experiment is not a fair one, therefore the results are unreliable. However, even in light of these reasons, I believe my experiment has been well planned out, and inaccuracies have been kept to a minimum using the equipment available to me. This is because all of the equipment I am using are fairly accurate, and have a very low percentage of error.
TEMPERATURE/ C°
TIME/SECONDS
RATE= 1/TIME/cm/s
Rate/10-3 cm/s
0
11.03
0.0090
0.90
0
10.09
0.0091
0.91
0
08.00
0.0093
0.93
0
08.50
0.0092
0.92
20
05.53
0.0095
0.95
20
04.68
0.0096
0.96
30
01.22
0.0099
0.99
30
98.90
0.0101
.01
40
97.12
0.0103
.03
40
96.43
0.0104
.04
50
91.75
0.0109
.09
50
92.35
0.0108
.08
The previous page shows my results and also a graph with my results. The graph clearly proves my prediction to be correct. It shows that as temperature increases, so does rate of reaction. It all backs up my theory, that at a higher temperature more particles have the minimum activation energy, and so they react quicker.
EXPLANATION
Rate of reaction rises as temperature increases because there are more particles with the necessary activation energy to have a successful collision, i.e. with enough energy to break bonds. When the particles are moving about quicker they are more likely to collide successfully. Although my results do not match my prediction perfectly, they do however follow the same line of best fit. Showing that my experiment has been successful, and the theory is correct.
Evaluation
I think that my experiment worked out well, because I got the results I was expecting. I believe that the experiment has worked out very accurate, as it not only fits in with my prediction well, it also matches the work of a previous scientific experiment as shown in the Bolzman distribution curve. Also, the points on the graph were kept very close together and also close to the line of best fit. Which would persuade me to believe they are accurate. For instance, if you look at points E1 and E2 on the graph above, you would see that they have only a 0.01 point difference (3 points). Also on this graph, the furthest a point is from the line of best fit is 0.05 away (13 points). All of this proves that this experiment has very accurate results. In my experiment, I had in fact planned to repeat each experiment three times. However, once I had repeated each one twice, I realised that the results were coming fairly consistently and so I had no need to repeat it a third time. If I were to do this experiment again I would have amended my method, and done each temperature with two test tubes at the same time. This would minimise the difference in result, and made sure both were done at the same temperature with no chance of error. Also, if I had the resources I would have replaced a couple of the instruments I used, for example:
=> I would have replaced the analogue thermometer I used, with a digital thermometer which would have been easier to read from, making sure I got the perfect temperature each time.
=> I would have replaced the measuring cylinder I used with a mouth pipette because it is more accurate, and so would make sure I got the right amount of HCl each time.
=>
=>
=>
=>