Results will be recorded in a results table, with 4 readings and an average time for each concentration value.
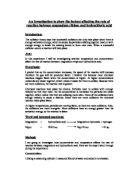
- I will conduct a preliminary experiment to investigate the optimum length of magnesium ribbon to be used in my experiments.
3cm, 2cm and 1cm of magnesium ribbon was dropped into separate beakers of 4cm3 of 2M hydrochloric acid. The time taken for the reaction to take place was measured with a stop-clock and recorded in the table below.
Any time values which take over 4 minutes to react are unacceptable, as 2M is the highest concentration available and so all other concentrations will be lower, taking longer to react, as in my prediction. There is not enough time allowed for me to carry out my experiments if the magnesium and hydrochloric acid takes a lot longer than 4 minutes each time, which lower concentrations would.
I can see from the above results that the length of magnesium ribbon best used in my main experiment would be 1cm.
I will now investigate the best volume of hydrochloric acid to be used in my experiments, with length of magnesium ribbon at 1cm. As previously stated, the highest concentration of acid available to me is 2 M. To achieve lower concentrations to be used in my experiment I will dilute the 2M of acid, but keep the volume the same.
e.g. - 4cm3 of hydrochloric acid:-
4cm3 of HCL = 2M
3cm3 of HCL + 1cm3 water = 1.5M
2cm3 of HCL + 2cm3 water = 1M
1cm3 of HCL + 3cm3 water = 0.5M
I will begin my investigation of volumes by using the above example and recording results in the table below.
4cm3
These results show that with 4cm3 of liquid being used, the lower concentrations take far too long to react. If I use a larger volume of hydrochloric acid I can achieve concentrations in between more easily, such as 1.75 M
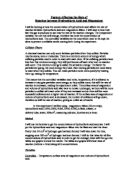
I will now investigate the times taken for 1cm of magnesium ribbon to react with a larger volume of acid in differing concentrations. I will use 25cm3.
25cm3 of HCL = 2M
21cm3 of HCL + 4cm3 water = 1.75M
19cm3 of HCL + 6cm3 water = 1.5M
12.5cm3 of HCL + 12.5cm3 water = 1M
6cm3 of HCL + 19cm3 water = 0.5M
I will only investigate the lower concentrations (1.5M, 1M & 0.5M), as these are where the time values are longest and where problems could arise.
25cm3
These results show that 25cm3 of hydrochloric acid is suitable to be used in my experiment. Although the 0.5M concentration takes 8 minutes 33 seconds, this is the only longer value so I will have enough time to repeat it another three times, as the other concentrations take no longer than three minutes each.
Fair Test
I will keep my experiment a fair test by keeping the following factors the same in each experiment:-
-
Volume of acid, 25cm3
- Length of magnesium (constant variable)
- The type of magnesium ribbon used i.e. all from the same roll, so that the thickness and width is the same. This is because wider ribbon would mean a bigger surface area of magnesium, speeding up rate of reaction.
Also, each beaker of hydrochloric acid will be taken from the same storage container with to ensure that it is all at as similar starting temperature as possible and that it is all 2M (before being diluted).
Each 1cm quantity of magnesium will be cleaned with emery paper before use to eliminate contamination from other chemicals which may be on the surface.
Each beaker of hydrochloric acid will be used only once.
The 1cm lengths of magnesium will be measured and cut as accurately possible using a ruler with millimetre measurements and sharp scissors.
The stop-clock used will be accurate to the nearest second.
The variable I will change in each experiment is:-
· The concentration of hydrochloric acid.
The apparatus and chemicals used for my experiment will be as follows:-
· 2 large beakers.
· 5 conical flasks
· a large measuring cylinder (that holds up to 25cm3 of liquid)
· supply of 2M concentration hydrochloric acid
· roll of magnesium ribbon
· supply of distilled water
· stop-clock
· ruler
Safety
Throughout all experiments I will be cautious when handling chemicals and wear the following safety items at all times:-
· lab coat
· safety goggles
Method
One large beaker was taken and filled with 2M hydrochloric acid. Another large beaker was taken and filled with distilled water. A stop-clock was taken and set aside. Five conical flasks and a measuring cylinder were taken. The measuring cylinder was used in the following way to achieve different concentrations:-
25cm3 of HCL = 2 mol.dm-3
21cm3 of HCL + 4cm3 water = 1.75 mol.dm-3
19cm3 of HCL + 6cm3 water = 1.5 mol.dm-3
12.5cm3 of HCL + 12.5cm3 water = 1 mol.dm-3
6cm3 of HCL + 19cm3 water = 0.5 mol.dm-3
When each of the above quantities had been measured out, each concentration was placed in its own conical flask.
A roll of magnesium ribbon was taken and a ruler was used to measure out and cut 5 pieces of ribbon, each 1 cm long.
One piece of magnesium was dropped into the 2M flask and the stop-clock switched on. The magnesium was closely observed and the stop-clock switched off when the magnesium was no longer visible and bubbles of gas ceased to be produced. The time on the clock was noted in a results table and the stop-clock was reset to 0. This process was repeated for the other 4 conical flasks containing different concentrations of acid.
All of the above was then repeated 3 more times in exactly the same way, giving 20 separate results in total.
Averages for each concentration value were calculated and also noted in the results table.
Results
Each measurement is stated in seconds to make calculations easier.
I will plot a graph of these results, showing average time taken in seconds on the x-axis against concentration of acid used, in mol.dm-3, on the y-axis.
Analysis of results
The line I have drawn through the points on my graph (see graph 1) is curved. It slopes downwards, showing that as concentration of acid decreases, the time taken to complete the reaction increases i.e. rate of reaction decreases. This suggests inverse proportion between concentration and time, but not direct proportion between concentration and rate of reaction. This supports my prediction. The gradient of my graph 1 seems to get generally smaller as the concentration of hydrochloric acid decreases. This also supports my prediction, showing that smaller concentrations = slower rate of reaction.
Rate of reaction = Gradient of best-fit line on graph, so I will now calculate the gradient of the line at the points plotted on my graph.
The gradients calculated are as follows:-
I have also plotted the above information on a second graph of concentration (x-axis) against gradient/rate of reaction (y-axis).
The graph (see graph 2) shows a smooth curve up to 2M.
Conclusion
I can conclude that as the concentration of acid increases when reacted with magnesium, the rate of reaction also increases. This supports my prediction. My results table shows this clearly, as the lowest concentration, 0.5M, took the longest time to react completely and the highest concentration, 2M, took the shortest time to react completely. Graph 1 clearly shows this, as a smooth curve. Graph 1 also shows the curve's gradient becoming smaller and smaller as the concentration decreases.
Because of this I plotted Graph 2, showing concentration against gradients of sections of the line in Graph 1. This graph shows another curve, with a peak of gradient value at 2M, as predicted. This suggests a quicker rate of reaction when the concentration was 2M than when it was the lower concentrations. This also supports my prediction.
The theoretical explanation for the rate of reaction increasing with concentration of acid is as follows. In a solution of a higher concentration, there are more particles to be found in a set volume than there would be in the same volume of lower concentrations. This means that when the magnesium is dropped into the acid, there are more HCL particles for magnesium particles to collide with, and react with in higher concentrations than lower concentrations. If particles collide more often, it will naturally increase rate of reaction. Also, in the lower concentrations used (below 2 moles), HCL had been diluted i.e. had added water particles as well as HCL particles. This would mean that magnesium particles would also collide with water particles, reducing the number colliding with HCL particles, and so decreasing rate of reaction.
The line on graph 2 is not straight as I predicted. The fact that the line in graph 2 is not straight suggests that while the rate of reaction does increase with concentration of acid, it is not a proportional relationship. The reason it is not proportional on my graph could be due to temperature differences amongst the quantities of acid used.
Evaluation
I think I have been successful in achieving my aim, as I have investigated a factor which affects rate of reaction between hydrochloric acid and magnesium ribbon. I have supported my prediction with my results and shown that there is a relationship between concentration of acid and rate of reaction.
I consider my results to be as accurate as possible, as each experiment was done 4 times and an average taken form the 4 results. This increases accuracy, so I am confident that my final conclusion is reliable. The results from which I calculated my averages were mostly not too far apart, so I think my averages are quite reliable. I also checked my calculations with a calculator to make sure I had not mad any errors.
I did have one anomaly in my results, which was the rate of reaction (gradient calculation) for 1.75M. This rate of reaction was 0.01 higher than the 2M rate of reaction, going against my prediction and causing an abnormality in the curve on my graph.
This may have been caused by the acid used to make up/water used to dilute the 1.75M of hydrochloric acid being at a higher temperature than the rest. If the liquid were at a higher temperature, the particles inside would have more energy and so be moving around faster. This would mean HCL and magnesium particles would collide more frequently, thereby increasing rate of reaction.
I think that my results on graph 1 were suitable to draw an accurate best-fit line. The points are all joined by the line.
I used 5 different concentrations which were in a suitably wide range.
If I were to repeat the experiment I would use a slightly wider range of concentrations to expand my conclusion, such as 1.25M, 0.75M and 0.25M. If the resources were available, I would also extend the range to higher concentrations than the 2M I was restricted to in this investigation.
Further investigation could also include using another factor as my independent variable.
I could differ the surface area of magnesium in my experiments, and see how this affects rate of reaction; in what way and if there is a definite proportional relationship.