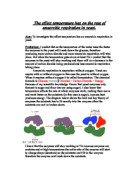
I predict that the bubbles will increase until a certain time where the process wont stop producing until the glucose particles have collided with all the yeast particles the they can not collide anymore this is when the bubbles stop producing, they start colliding because temperature does increase the rate that particles move in.
The things that I will measure are as follows:
- Beakers
- Yeast
- Glucose
- Time
- Temperature
- Volume
In order for me to measure the glucose, yeast I will use a measuring cylinder. Measuring cylinder is the best thing for this kind of small measuring I chose this method because it is precise and easy to use.
The quantities that I will change will be the glucose and yeast because then I can find out which is the formula that will produce the most bubbles. I also could of changed the time, but I didn’t because I ran out of time unfortunately, this would of told me more on how temperature does effect on respiration in yeast, because instead of the 30 seconds I would of done 40 seconds, which I think would of lead to me find out that a lot more bubbles are produced and then recording this in o graph and basically going in to futher detail and invertigatiomn
In order to keep the experiment a fair one I will carry out the following:
- Keep all measurements the same as the previous experiment/s.
- Time limit the same.
- Record all results the same also.
So that my experiment is safe I will
- Put my stool under the desk.
- Wear goggles.
- Clear desk.
Table of first readings second readings
The things that may make my experiment inaccurate could be:
- Time
- Temperature
- Measurement
- Same apparatus.
In my experiment I didn’t make any mistake to my knowledge, I put my stool under my table, wore goggles, and cleared my desk so that that I would be safe from any chemicals that may spill.
The measurements I used added up to twenty-five for example: five mills glucose and 20 mills yeast. (These changed each time)
The average amount of bubbles= 532 % 29 = 18. 3 bubbles (1.dp)
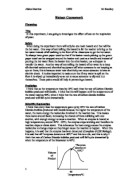
The first set of results told me that: between o% and 18% there wasn’t a change in the respiration of yeast and glucose, but when it reached 19% the respiration began to increase rapidly up to the peak point of 48% with 46 bubbles. From 48% it then started to decease quickly until it hit the bottom at 63% with no bubbles where it stayed at a result of 0 bubbles all the way to a 100% where I could clearly see there wasn’t going to be a change so I ended the experiment.
The second set of results told me: between 0 and 18% there was no bubbles produced, but from 19% to 56 % bubbles increased from 3 to 48. From 48% to 62% bubbles decrease to 0 and stayed this was until the experiment was over.
From my tables and graphs I have learnt that 19 % is the point where yeast and glucose begin to respirate. And around 62 % is where the yeast begins to run out and gradually stops producing bubbles. I think the yeast runs out because the glucose can no longer feed it or the other alternative is the glucose runs out because the yeast thrives on it which causes the yeast not to respirate and there for the process the ends.
From what the graphs and tables told me, it has proven my prediction wrong.
My result I think were good and told me what I think is the right answer, I think now I have done the experiment that I should have done more experiments and really proven my conclusion with more than a few graphs.
The thing that didn’t seem to fit which happened in both cases of my experiments was that once the temperature had reached 62 % (which was the end of the respiration) it didn’t have any bubbles then when it reached about 70 % it produced a bubbles I think this is because the yeast still respirates a bit, and produces its final bubble?
My results did help me solve my problem because the temperature did effect the respiration in yeast (as I stated above).
I think my results are fairly reliable but not as reliable, as If I would have done them more than twice.
If I was going to do my experiment and whole investigation again I would the only thing I would change would be more results. So I would have a firmer conclusion. Also because my formula added up to 25 mills I think I would increase that to about 50 mills and see if this made any difference. If I were going to increase the concentration to 50 mills I think my prediction would be that instead of the peak temperature being around 62% I think I t would be around 100%. I thought this because it would take longer for the yeast to respirate.
There were a number of things that were inaccurate in my experiment the first one being the temperature, I wasn’t sure if I was supposed to start the stopwatch then record the bubbles for 30 seconds or time 30 seconds then record the bubbles. Looking back now on my experiment I see that I should of changed my water every time, i.e.) once I have recorded the bubbles for 10 degrees then change the water and then heat it too 20 degrees and record it.