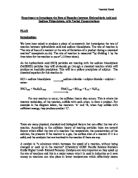
I expect that the reaction that occurs will be exothermic, and so it will give out heat. I predict this because as a precipitate is being formed I think that the amount of energy needed to break the bonds will be less than the energy needed to make the new bonds. Here is an energy diagram showing an exothermic reaction:
(Diagram from www.gcsechemistry.com)
As the hydrochloric acid (HCl) particles are reacting with the sodium thiosulphate (Na2S203) particles they will obviously go through a chemical reaction:
Sodium Thiosulphate + Hydrochloric Acid ?
Na2S2O3 (aq) + 2HCl (aq) ?
I would predict that the result of the reaction would be:
HCl + sodium thiosulphate sodium chloride + sulphur dioxide + sulphur + water.
2HCl (aq) + Na2S2O3 (aq) 2NaCl (aq) + SO2 (g) + S (s) + H2O (l)
I predict that the sulphur will form an insoluble precipitate as a product of the reaction and it will make the colourless solution go cloudy. Also the sulphur dioxide will be the gas produced and the remaining solution will be the sodium chloride.
Apparatus:
- 8g/Litre Sodium thiosulphate solution (0.15 mol.dm-³)
- 2M Hydrochloric acid (dilute)
- Distilled water
-
Stopwatch (accuracy to 100th of a second)
- Thermometer (0-110°C), measures in 1°C units.
- White paper/card with a large black cross (X) drawn on it
- Felt tip pen
- 250cm³ conical flask
- 10cm³ measuring cylinder
- 50cm³ measuring cylinder X 2
- 250cm³ beaker X 2
- 100cm³ beaker
Preliminary Experiment:
Before the actual experiment was conducted I carried out a preliminary experiment, which is in others words, a trial run. I did this so that I could see whether the method I was going to use in the actual experiment was an effective one that will give good results.
After I had completed the preliminary experiment I recorded the results in the following table:
Results Table for the Preliminary Experiment:
I also made observations from my preliminary run. From my results and observations I made adjustments and modifications to my method to make my results more accurate. The changes I made were as follows:
- I doubled the volume of hydrochloric acid added to the reaction from 5cm³ to 10cm³ as the time taken for the precipitate to form took quite a while and therefore to make the rate of reaction quicker I used more reactants, namely hydrochloric acid. This is so that there will be more reactant particles involved in the reaction so as to increase the rate of reaction as there are more successful collisions occurring.
- I also decided to stir the solution while the reaction was taking place so that it became homogeneous. This is because in the preliminary experiment I noticed that as the reaction took place the precipitate formed in the middle first, which meant that the solution was heterogeneous. This is because when the hydrochloric acid was poured into the conical flask it remained around the centre of the solution and had not spread out evenly. Therefore by stirring it the reactants will be evenly distributed.
- I have also decided to measure the temperature of the solution before and during the reactions are taking place as in the preliminary experiment I only took it before the precipitate formed. As a result I could not tell whether the reaction that occurred was exothermic or endothermic.
OBTAINING EVIDENCE
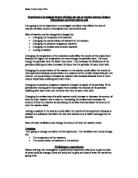
Method:
- Firstly make sure you have all the apparatus necessary to conduct the experiment.
- Place the safety mat on the table and put the card with the large X on it. Then put the conical flask on top of it.
- Put on the safety goggles and wear them at all times.
- Fill the 100cm³ beaker with the hydrochloric acid and the 250cm³ beaker with the sodium thiosulphate and the other 250cm³ beaker with the distilled water.
- After the beakers have been filled label them using a washable ink felt tip pen with the names of the liquids inside the corresponding beaker. E.g. label the 250cm³ beaker with the water in it ‘Water’ or ‘H20’.
- Fill the 10cm³ measuring cylinder with 10cm³ of hydrochloric acid.
- Then fill the 50cm³ measuring cylinder with 50cm³ of sodium thiosulphate.
- Pour the sodium thiosulphate from the measuring cylinder into the conical flask.
- Place the thermometer in the conical flask and then add the hydrochloric acid, from the measuring cylinder, into conical flask with the sodium thiosulphate.
- As soon as all of the hydrochloric acid has been added, to the conical flask, start the stopwatch and note down the temperature of the solution.
- As the reaction takes place note the temperature again, if there is a rise or fall in temperature, i.e. note the change in temperature.
- Look directly down into the conical flask from above, (from a Birdseye view), and observe the large X disappearing. As soon as the X disappears and is not visible anymore stop the stopwatch. Note the time taken for the reaction (reaction rate).
- Remove the thermometer and thoroughly wash and rinse out the conical flask and place it back on the large X on the safety mat.
- Measure 10cm³ of hydrochloric acid in the 10cm³ measuring cylinder again and this time measure 40cm³ of sodium thiosulphate in the 50cm³ measuring cylinder.
- Also measure 10cm³ of distilled water in the other 50cm³ measuring cylinder.
- Add the sodium thiosulphate from the measuring cylinder to the conical flask and also the distilled water. Put the thermometer back in to the conical flask.
- Again add the 10cm³ of hydrochloric acid to the conical flask and start the stopwatch simultaneously once all the hydrochloric acid has been poured in.
- Repeat steps 10-13.
- Measure 10cm³ of hydrochloric acid in the 10cm³ measuring cylinder again and this time measure 30cm³ of sodium thiosulphate in the 50cm³ measuring cylinder. Also measure 20cm³ of distilled water in the other 50cm³ measuring cylinder.
- Repeat steps 16-17.
- Repeat steps 10-13.
- Measure 10cm³ of hydrochloric acid in the 10cm³ measuring cylinder again and this time measure 40cm³ of sodium thiosulphate in the 50cm³ measuring cylinder. Also measure 10cm³ of distilled water in the other 50cm³ measuring cylinder.
- Repeat steps 16-17.
- Repeat steps 10-13.
- Repeat this method from 1-24 again so that you are able to obtain two sets of results.
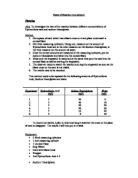
Fair Test:
To make my experiment a fair test I will have to keep certain factors constant and some factors I will have to vary. I will do this so that my experiment runs smoothly and I am able to obtain the most accurate results as possible. I have listed the variable and constant factors in a table as follows:
I will have to keep the temperature constant throughout the experiment so that the rate of reaction is not affected. This is because if the temperature increases the particles will gain more heat energy, which is converted into kinetic energy. This makes the particles move around faster, resulting in more useful collisions (since they collide more often), as “temperature increases the number of collisions”(CGP Chemistry GCSE Double Science Revision Guide Higher Level- Richard Parsons), which effectively accelerates the rate of the reaction and therefore making the experiment unfair. However I will not be able to keep the temperature constant during this experiment, as I have no control over it, although it would more or less be constant as the external conditions were not altered much.
The stopwatch that is used to time the rate of reaction should be kept the same throughout the whole experiment. This is because different stopwatches may have a very minute and fractional difference in their timing, which would make and increasingly larger difference as the time continued affecting the outcome of my results as they are timed at different rates. So for more precise and accurate results I will keep the stopwatch that I used constant.
The measuring cylinder in which the amount of hydrochloric acid is measured must be kept the same to ensure that the volume of hydrochloric acid is the same in each of the reactions that takes place. If the volume is different then it will affect the rate of reaction, as explained in more detail above, under the total volume of the hydrochloric acid and the sodium thiosulphate.
The beakers used which contain the hydrochloric acid, water and sodium thiosulphate must be kept the same so that the liquids do not mix which would contaminate them. If this occurs then it will affect the accuracy of the results and the rate of reaction. For example if the hydrochloric acid was accidentally mixed with water then it would become more diluted and so the rate of reaction would be slower.
The person using the stopwatch and timing the rate of reaction must be kept the same throughout the whole experiment so that the results are more precise. This is because if different people are used for the timing, they will time with a different accuracy and precision, so it is much better to use the same person so the results are all equal in the way they were timed.
The person measuring the volumes of the hydrochloric acid, the sodium thiosulphate and the water must be kept the same throughout the experiment for more precise results. This is because if different people are used, they will also measure with a different precision, so for equal results the same person must me used.
The position of the experiment must not be changed as this can affect the rate of reaction if there is an alteration in conditions for the experiment. For example if it is moved into a warmer position then the rate of reaction will increase as “temperature increases the number of collisions”(CGP Chemistry GCSE Double Science Revision Guide Higher Level- Richard Parsons). This is because if the temperature is raised the particles will gain more heat energy, which is converted into kinetic energy, making the particles move around faster, resulting in more useful collisions (since they collide more often). If the temperature decreases then the opposite will happen and the rate of reaction will slow down.
The hydrochloric acid and the sodium thiosulphate must be changed for each reaction, when in the conical flask, because if you use the same hydrochloric acid and sodium thiosulphate from the last reaction then it will slow down the rate of the reaction in the current reaction. This is because the hydrochloric acid and the sodium thiosulphate have already been reacting in the previous reaction, which means they will be less concentrated as it has lost some particles during successful collisions in the last reaction. Obviously this would affect the present reaction, as there are now fewer hydrochloric acid particles and sodium thiosulphate particles to react with eachother which would decrease the rate of reaction. The problem with this is that it will make the experiment unfair.
The concentration of the hydrochloric acid must be kept constant for each reaction, in the conical flask. This is done because it is a requirement for the experiment, which is to find the how the rate of reaction is affected with varied concentrations of the sodium thiosulphate.
Safety:
This experiment poses many dangers to the safety and health of others and myself and so I will ensure that the following precautions are followed.
- Hydrochloric Acid is corrosive. Avoid contact with the skin. If contact does occur rinse thoroughly with cold water and alert your supervisor immediately.
- Hydrochloric acid is used in detergents as toilet cleaner and can therefore be used in bleaching agents. So for extra safety precautions wear a lab coat or some form of protective clothing so it does not bleach of damage your clothes.
- Wear goggles when conducting the experiment to avoid any contact of harmful substances with the eyes. Contact of the eyes with hydrochloric acid is dangerous because corneal burns can occur very rapidly. Therefore, safety glasses or, preferably, goggles should always be worn when handling concentrated hydrochloric acid. If, however, any hydrochloric acid does come into contact with the eyes, wash eyes thoroughly with water and alert your supervisor immediately.
- Do not leave your experiment unattended as accidents may occur if it is left unsupervised (this would also affect the accuracy of your results if you misconduct the experiment).
Results:
Results Table 1 (For the first set of results):
Results Table 2 (For the second set of results):
ANALYSING EVIDENCE AND DRAWING CONCLUSIONS
Analysis:
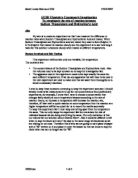
In the Results Table 1, which were my first sets of results for the actual experiment, it shows that as the concentration of the sodium thiosulphate decreases, then the time for the reaction to occur increases. For example when the concentration is 0.15 Mol.dm-³ the time for the reaction is 20.00 seconds, at 0.12 Mol.dm-³ the time is 28.16 seconds and at 0.09 Mol.dm-³ the time taken is 38.28 seconds. This is because as the sodium thiosulphate is diluted further then it becomes less concentrated. This therefore means that there are less sodium thiosulphate particles in the solution and so the chance of successful collisions decreases, since the chance of the sodium thiosulphate particles colliding with the hydrochloric acid particles has declined, due to the fewer sodium thiosulphate particles. This means that there is now a greater proportion of water particles that get in the way of the reactant particles. This slows down the time for the reaction to occur as collisions do not occur as often, which determines the speed of the reaction.
The Results Table 1 also shows that as the as the concentration of the sodium thiosulphate decreases so does the rate (1/time) of the reaction. This is shown by the data in the table. E.g. When the concentration is 0.15 Mol.dm-³ the rate of reaction is 5.00 (X 10-²), at 0.12 Mol.dm-³ the rate is 3.55 (X 10-²), and at 0.09 Mol.dm-³ the rate is 2.61 (X 10-²). This happens because the time for the reaction to occur takes longer so the rate of reaction is lower.
The data in the Results Table 1 also shows that when there was no amount of sodium thiosulphate present, so that there was only hydrochloric acid and water in the conical flask, a reaction did not take place and so the time and rate of the reaction was infinite. This part of the experiment was conducted as a control to show that when there is only one reactant, not two, then a reaction does not occur. This is because for a reaction to take place it needs two reactants which can react together to form the product. In this case the product was the sodium precipitate, and since there was only the reactant of hydrochloric acid present a precipitate did not form, as there was no reaction. As a precipitate did not and would not form it means that the time for the reaction would be infinite as it would never happen.
In the Results Table 2, which are my second set of results, it shows similar patterns to the data in the Results Table 1. Therefore it also shows that as the as the concentration of the sodium thiosulphate decreases, then the time for the reaction to occur increases. The recordings in the table show this, E.g. when the concentration is 0.15 Mol.dm-³ the time for the reaction is 29.24 seconds, at 0.12 Mol.dm-³ the time is 36.34 seconds and at 0.09 Mol.dm-³ the time taken is 47.21 seconds. Again this is because as the sodium thiosulphate is diluted further it becomes less concentrated and so there are less “molecules per set volume” (. This means that there are less successful collisions taking place, as there are fewer reactant particles of sodium thiosulphate, which leads to a slower rate of reaction.
This decline in the rate of reaction is shown by the results. E.g. When the concentration is 0.15 Mol.dm-³ the rate of reaction is 3.42 (X 10-²), at 0.12 Mol.dm-³ the rate is 2.75 (X 10-²), and at 0.09 Mol.dm-³ the rate is 2.12 (X 10-²). This happens because the time for the reaction to occur takes longer so the rate of reaction is lower. These results also show how the rate of reaction decreases at a decreasing rate as the concentration of the sodium thiosulphate decreases.
The Results Table 2 also shows that when there was no amount of sodium thiosulphate present, a reaction did not take place and so the time and rate of the reaction was infinite, as the Results Table 1 showed initially. This again was due to the fact that there was only one reactant present and therefore a precipitate did not form, as a reaction did not take place.
Graph 1 and Graph 2 show the time against concentration graphs with the curves of best fit for both the first and second results table data. The Graph 1 is lower down than the Graph 2 which shows that the experiment, which gave the data for the Results Table 1, was quicker than the experiment which gave the data for the Results Table 2. The points on the graph prove this because when the concentration of the sodium thiosulphate was 0.15 Mol.dm-³ the time taken for the reaction for Graph 1 is 20.00 seconds but for Graph 2 it takes 29.00 seconds at the same concentration. Also at 0.06 Mol.dm-³ for Graph 1 it takes 68.00 seconds but for Graph 2 it is 88.00 seconds. Again this shows that the first set of results had the fastest reactions as they took a shorter time to occur.
Graph 1 and Graph 2 both have a negative correlation, which means that the time is inversely proportional to concentration. This is shown because as the concentration increases, the time for the reaction to take place decreases, and as the concentration decreases, the time for the reaction to take place increases. This pattern is shown by both of the graphs: on Graph 1 when the concentration was 0.15 Mol.dm-³ the time taken for the reaction was 20.00 seconds, at 0.12 Mol.dm-³ it took 28.00 seconds, and at 0.09 Mol.dm-³ it took 38.00 seconds. This pattern was the same for Graph 2, E.g. when the concentration was 0.15 Mol.dm-³ the time taken for the reaction was 29.00 seconds, at 0.12 Mol.dm-³ it took 36.00 seconds, and at 0.09 Mol.dm-³ it took 47.00 seconds.
The reason for this pattern on Graph 1 and Graph 2 is due to the collision theory, which happens while the reactions take place, which is by ‘Increasing the concentration of a substance in solution means that there will be more particles per dm3 of that substance’ (www. gcsescience.com). So the more particles there are in the substance ‘the more will collide per second, and so the rate of reaction increases’ (www. gcsescience.com). As the rate of reaction increases it means that the reaction will happen faster and in a shorter time so the time value is less.
Graph 1 and Graph 2 become much steeper as the concentration decreases. This means that the time taken for the reaction to take place increases at an increasing rate as the concentration of the sodium thiosulphate decreases. This is because when a reaction occurs the reactant particles become used up during successful collisions. As a result there are less ‘particles of reactant knocking about between the water molecules which makes collisions between the important particles’, (Chemistry GCSE Double Science Revision Guide Higher Level- Richard Parsons), less likely so there are fewer successful collisions in the same amount of time. Therefore as the reaction progresses and the concentration decreases, due to reactant particles haven already reacted, the time for the reaction to occur increases. For example when the concentration of the sodium thiosulphate is at its lowest in the experiment, at 0.03 Mol.dm-³, the reaction takes longer due to the fewer reactant particles and it takes even longer as the reaction progresses. This causes the graph to become even steeper as the concentration is decreased each time during the reaction.
Graph 3 and Graph 4 show the rate (1/time) against concentration graphs with the lines of best fit for both the first and second results table data. Graph 3 is steeper then Graph 4 which shows that the experiment, which gave the data for the Results Table 1, had quicker reactions than the experiment which gave the data for the Results Table 2. The points on the graph prove this because when the concentration of the sodium thiosulphate was 0.15 Mol.dm-³ the rate of reaction for Graph 3 is 5.80 (X 10-²) but for Graph 4the rate is 3.60 (X 10-²) at the same concentration. This occurs throughout all the concentrations: at 0.06 Mol.dm-³ for Graph 3the rate is 1.60 (X 10-²) but for Graph 4it is 1.25 (X 10-²). Again this shows that the first set of results had the faster set of reactions as they took a shorter time to occur.
Graph 3and Graph 4 both have a positive, which shows that rate, is proportional to concentration. The graph shows this because as the concentration increases, the rate of reaction increases and as the concentration decreases, the rate of reaction decreases. This relationship is shown by the pattern of results and the graphs: on Graph 3 when the concentration was 0.15 Mol.dm-³ the rate of reaction is 5.80 (X 10-²), at 0.12 Mol.dm-³ it is 3.70 (X 10-²), and at 0.09 Mol.dm-³ it is 2.65 (X 10-²). This pattern was the same for Graph 4, E.g. when the concentration was 0.15 Mol.dm-³ the rate of reaction is 3.70 (X 10-²), at 0.12 Mol.dm-³ the rate is 2.80 (X 10-²), and at 0.09 Mol.dm-³ it is 2.25(X 10-²).
This pattern and relationship between the concentration and the rate of reaction on Graph 3 and Graph 4 is due to the collision theory, which occurs while all the reactions take place. “ If the solution is made more concentrated it means that there are more particles of reactant knocking about between the water molecules which makes collisions between the important particles more likely” (Chemistry GCSE Double Science Revision Guide Higher Level- Richard Parsons). This increase in successful collisions makes the reaction occurs quicker as more particles are reaction and so the rate of the reaction increases.
Observations:
When the experiment was in progress and the reactions were taking place I noticed that after the hydrochloric acid was added to the solution, of sodium thiosulphate and water, the temperature of the solution rose slightly by approximately 0.5°C each time.
Also I noticed that when the water, hydrochloric acid and sodium thiosulphate was added to the conical flask, a minute amount of the liquid remained in the measuring cylinders.
Another observation was that when the experiment for the first set of results was conducted the temperature range of the solutions was different to the repeated experiment from which I obtained my second set of results. F or example the temperature range for the first set of results was 25-26°C and for the second set of results it was 21-22°C.
Conclusion:
I initially predicted that as the concentration of the sodium thiosulphate increases, the rate of reaction between it and the hydrochloric acid will also increase. This was proven by my results, which showed that the concentration was proportional to the rate of reaction. This relationship was explained by the collision theory of particles, which says that as the concentration increases so does the rate of reaction. This is because as the concentration increases there are more reactant particles per set volume and so there is a greater chance of successful collisions. As more useful collisions are occurring, as they collide with sufficient energy, the reaction happens more quickly and so the rate of reaction increases. This is shown by the positive correlation of the rate against concentration graphs.
As all my results did not fit perfectly into a curve of straight line I had to construct lines and curves of best fit. The reason why the results were not perfect is that the experiment was not completely fair and it contained many experimental errors, most of which cannot be avoided, such as the change in the room temperature and if someone accidentally knocked the table on which the experiment was situated.
I also predicted that the rate of reaction would decrease if the reaction progresses for long enough. The evidence showed this on my time against concentration graph, which proved the prediction to be right. It was shown on Graph 1 and Graph 2 because these graphs became steeper as the concentration decreased which shows an increasing increase in the time for the reaction to take place.
In my prediction I also said that the decrease in the concentration should be proportional to the decrease in the rate of reaction. The Graphs 3 and 4 show this proportionality. E.g. in the Results Table 2 when the concentration of the sodium thiosulphate is 0.15 Mol.dm-³ the rate was 3.42 (X 10-²). When the concentration is decreased by 20% to 0.12 Mol.dm-³ the rate should theoretically also decrease by 20% to 2.74 (X 10-²). In the Results Table 2 at 0.12 Mol.dm-³ the rate was 2.75 which again proved that the rate and concentration was proportional.
This exothermic energy diagram shows that the energy needed to break the bonds is less than the energy needed to make the new bonds. Bond breaking absorbs energy and bond making releases it so as the energy needed to make the bonds is greater the reaction releases heat. This explains why the temperature increased during the reactions.
Using the collision theory I have come to the conclusion that for a reaction to take place two reactant particles must collide with sufficient energy. In order to do this they must overcome an energy barrier called activation energy, which is the minimum amount of energy that they must collide with in order for the reaction to occur. The more successful collisions there are the quicker the reaction will be. The particles also have to collide with the “correct orientation and must fit together, this is called the 'lock and key theory” (science website).
down into simpler molecules such as water and sulphur dioxide.
Evaluation:
I think that the experiment was carried out very well as the results that were recorded were what I had predicted and supported my conclusions. Also the safety procedures were followed carefully so no accidents took place and nobody was injured.
The evidence that I recorded was valid as it shows how the rate of reaction changed when the concentration of the sodium thiosulphate was varied. As this was what I was trying to find out the experiment gave the right results, which answered what I was looking for. It was a fair test as I followed the plan carefully and the fair test. Also it was fair as I repeated the experiment twice to make sure that the first experiment went well, and because they both gave similar results that showed the same patterns the experiment went to plan. The evidence and results I obtained were sufficient to support my conclusions as they show clear patterns and relationships between the independent variable and dependant variable.
Although I conducted the experiment as accurately and precisely as I could, there were many experimental errors in the method that I had used. This means that there are a number of ways in which I could have improved my experiment one of which is to have been more accurate on several parts as accuracy is a key part to an experiment in order to get good results. One of these parts is the measurement of the hydrochloric acid, sodium thiosulphate and the water in the measuring cylinders. I could have used a more accurate measuring cylinder with smaller and more precise measurements so that I could make even more sure that they were the correct measurements and more accurate
Another factor that would affect the accuracy of my results is the precision of the stopwatch. This would hardly affect the accuracy of my results, only by a fraction of a second. It would certainly not affect my conclusion as long as my results are as they should be.
I think my experiment would have been much better and more precise if I had used the same hydrochloric acid and sodium thiosulphate from the same bottle. This is an experimental error because the concentration of the hydrochloric acid and the sodium thiosulphate may have been slightly different, in the different bottles, which would have produced an inconsistent and unfair rate of reaction. This may also be the reason why the results I obtained did not fit exactly into a curve for the graph I constructed, as some of the values were outside the curve. These results are known as anomalous points. To solve this problem, I could repeat the experiment but this time I would use the same hydrochloric acid from the same bottle and the same sodium thiosulphate from the same bottle so it would provide an even more accurate reading, as the concentration of the liquids will be the same.
The anomalous points could have been caused by several other reasons such as that the temperature could have fluctuated by an amount high enough to cause the rate of reaction to increase or decrease enough so that it did not follow the normal pattern as the other reactions followed. Also the anomalous points could have been due to a slightly unequal amount of one of the reactants which affect the rate of reaction. Also the experiment could have been jogged which would have stirred the solution around a little which would cause more successful collisions to occur and the rate of reaction to increase.
There were a few difficulties that I encountered whilst conducting my experiment. Firstly I found it difficult to get the right volume, as the measurement units were not small enough. I could overcome this by using a pipette, which would allow me to get the volume more precise, or I could use a measuring cylinder with small measurements. Also I found it hard to decide whether the large X had disappeared or not as I was looking at the cross for a long period of time. This can be overcome by using the ultra-violet lamp and photoelectric cell technique. Another difficulty that I faced as starting the stopwatch as soon as all the hydrochloric acid was added to the conical flask.