I have chosen to investigate length, which will be the only variable that I will change. I chose this because it is easier to investigate. I did not choose temperature because it is very difficult to get accurate readings. Any incorrect reading will affect my final result. Since I had only two types of wires, therefore I did not choose cross section area and different material.
Prediction justified by scientific knowledge.
Increasing the length of a wire will have a direct affect on its resistance. I predict that if the length of a wire increases, its resistance will increase. I predict this because a longer wire has more atoms and so they will collide with electrons more often. Since I know that resistance is directly proportional to the length, therefore I predict that if the length is doubled, the resistance will be double. The reason is that doubling the length means doubling the number of atoms. Doubling the number of atoms means doubling the number of collisions, which also means doubling the resistance and halving the current.
Since R∝L, therefore I predict that my graph should be a straight line.
Secondary sources used:
I obtained most of the information from my notes and exercise book. I also obtained information from several science textbooks and from the Internet.
I use the following textbooks:
Preliminary work.
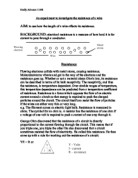
In my preliminary experiment I will use this circuit to get readings.
+ −
+
−
+ −
The wire I am going to use is 28SWG CONSTANTAN. The purpose of preliminary experiment is to familiarise myself further with the method. Doing this I can get precise and reliable results in my main experiment.
Since I am going to investigate length, therefore I also need to find out about the range of lengths. I will get five readings to plot a graph.
I will use the same wire (with the same temperature and diameter) throughout the whole experiment. I will also use constant voltage of 4 volts.
Apparatus.
1. Battery;
2. Voltmeter; to measure voltage
3. Ammeter; to measure current
4. Crocodile clamp; to connect the wire (28SWG CONSTANTAN) to the circuit
5. Connecting wires.
6. Tapping key.
7. Metre ruler.
The wire (28SWG CONSTANTAN) was cello taped to the ruler.
Since I know that R=V/I, therefore I will use this equation to find resistance.
Results.
Main experiment.
Apparatus.
1. Battery; (4volts)
2. Voltmeter; to measure voltage
3. Ammeter; to measure current
4. Crocodile clamp; to connect the wire (28SWG CONSTANTAN) to the circuit
5. Five connecting wires;
6. Variable Resistor (Rheostat);
7. Tapping key.
8. Metre ruler.
Safety.
I need to consider safety whilst carrying out the experiment. I will be careful when handling live wires. After taking one reading I will switch off the battery. Then I will measure the length of the wire for next reading.
Variable factor.
The only variable is the length of the wire.
Constant factors.
For every reading these will stay constant.
Wire (28SWG CONSTANTAN);
Temperature of the wire (room temperature);
Voltages (4volts);
Diameter of the wire (0.3759mm).
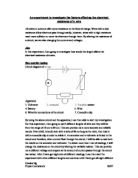
Circuit diagram.
Battery (4volts)
Rheostat
Mere rule and wire
Tapping key
Ammeter Crocodile clamp Voltmeter
I have decided to start from 20cm because at 10cm resistance was very low. I will increase them by 20cm to get high readings because with high readings I can plot graph easily.
It is always good to repeat the experiment. I decided to get two readings for every different length using Rheostat. Then I will get the average. The readings I am going to use are 20cm, 40cm, 60cm, 80cm, and 100cm. I have chosen these readings as I can measure them easily by meter ruler. Since the Ammeter I used is 0 – 5 scale, therefore I will divide the readings by 10 to bring it down to 0 –1 scale.
Method.
1. I drew results table.
2. I set the circuit as I shown in the diagram.
3. I set the length of the wire to 20cm.
4. I put the other side of tapping key on that length.
5. I switched on the battery.
6. I measured the current from Ammeter using top scale, which were 3.8 amps.
7. I wrote this in table1 as I1.
8. I measured the volts from Voltmeter using bottom scale, which was 0.50 volts.
9. I wrote this in table1 as V1.
10. Then I got all other readings going down by 20cm.
11. I wrote all these readings as I1 and V1.
12. Then I changed the variable resistor (Rheostat) to another value to get different readings.
13. I repeated all the experiment.
14. I wrote these readings as I2 and V2 in table 2.
Obtaining evidence.
Results.
Table1.
I used the following equation to calculate the resistance.
R1= V1/(I1÷10)
Table 2.
I used the following equation to calculate the resistance.
R2=V2/(I2÷ 10)
Table 3.
Average resistance= (R1 + R2)÷2
Analysing evidence and drawing conclusion:
I have drawn three tables to make the data understandable. To work out the average resistance, I added up both the results and divided them by two. Taking an average of the results can give them more reliability. The results were recorded to two significant figures. Since I used 0–5 scale ammeter, therefore I divided the current by ten to bring down to 0–1 scale.
Altogether I used five different lengths in my experiment, 20cm was the shortest length that I used; there was a lowest resistance. 100cm was the longest length that I used; there was a highest resistance.
I repeated all five results to be sure that they were reliable and in all cases I found that the longer the wire, the higher the resistance was. I had stated this in my prediction, so my prediction was right.
However I also predicted doubling the wire will double the resistance and half the current. I have discovered in my results that resistance goes approximately double and current also goes approximately half. So my prediction coordinates with my results.
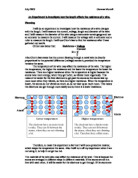
Resistance occurs when electrons travelling along the wire collide with the atoms of the wire. An increase in collisions will increase the resistance. If the wire is double the length of certain wire, it has double the number of atoms; this means that electrons will collide with the atoms double the amount of times. Hence resistance will be double. I can see this in my results. When the length of the wire was 20cm, the resistance was 2.0ohms and when the length of the wire was 40cm, the resistance was 4.1ohms, which is approximately double of 2.0ohms. Also if the length is treble or quadruple then the resistance is also goes double or quadruple. As an example at 60cm and 80cm, resistance is 6.0 and 7.9ohms, which are treble and quadruple of 2.0 ohms.
In this experiment my aim was to find out that the resistance changes with any change in length. My prediction matched and concluded with my results as you can tell from the graph. Resistance increases when length increases. This is what I expected. I have drawn a graph resistance against length. Two points fit the line and other three are extremely close to the line indicating that my results are accurate. My graph is a straight line passing through the origin. This means that if the length increases, the resistance increases.
R∝L
Since graph is passing through the origin, therefore if there is no length there will be no resistance.
Evaluating evidence:
I think my results were good enough to draw a conclusion. The procedure used was good and produced good results. The results are mainly good, there are no odd results and everything came out as expected. This could mean that experiment was done perfectly but it doesn’t. Although all the average resistances and currents confirm to a pattern but they are not evenly spaced and therefore are not probably perfect.
I did not get any anomalous result. Three points are not fitting the line but they are extremely close to the line showing that there must have been a very slight error in my experiment. In my thinking the reason for this is that it was very hard to stretch out the wire and consequently, measure it accurately.
To improve my results,
1.I would do more preliminary work to make my method more accurate and that I was more familiar with doing the experiment.
2. I think it would be a good idea to repeat the experiment more than two times. It will improve average results.
3. I think it would be better to work with another person so one person will put devices together while other will check (and write) the readings.
4. I would use pointers instead of crocodile clamp because the tips have a smaller area and would give more accurate measurement of the wire.
5. I would use a digital Voltmeter to get more accurate readings.
6. I would control the room temperature as I just assumed 20°C in this experiment.
Additional work could be carried out to repeat the experiment using a wider range of lengths. The investigation could also be extended to investigate other factors, such as different widths of the same wire and different types of wires.