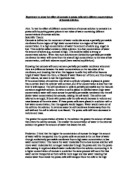
In this diagram there is no movement. There is a dynamic equilibrium. There are equal particle numbers moving each way through the selectively permeable membrane.
In plant cells the cell membrane is surrounded by a thick cellulose cell wall. Cellulose is freely permeable to all liquids but it stretches very little. When the potato cells loose mass the vacuole will loose water and turgidity and become flaccid. The cell membrane pulls away from the side and the cells begin to wilt. There is a limit as to how flaccid or turgid it can become. Plant cells expand until their cellulose walls can stretch no more, or until pressure from surrounding cells stops them from expanding. The cells are fully turgid. The stretched cellulose wall and surrounding cells exerts an inward pressure, which eventually equals the osmotic pressure of the cell sap, so osmosis stops. This process is called plasmolysis. There will be a limit as to how much water can be obtained and lost from the potato cells.
Hypothesis:
Using the evidence I have presented, I can make a firm prediction. I predict that at the start the potato will gain mass because the concentration of sugar will be higher in the potato, which means that there was a low concentration of water. Outside the potato in a low concentration and hypo tonic solution there will be less sugar and therefore more water, the water will move due to osmosis down the concentration gradient and into the potato. A dynamic equilibrium will be reached. In the higher concentrations and hyper tonic solution the water concentration will decrease as the sugar level increases and the water will move out of the potato from the low concentration of water to the higher concentration outside the potato. I also predict that there will be a limit as to how much water can be obtained and pushed out from the potato. There will be a limit to how flaccid and turgid the potato cells can become.
Plan:
Apparatus:
Measuring cylinder
Scales
Beakers x 10
Knife
Sucrose (sugar-water solution)
Clock
Metal rod
Preliminary Work:
A piece of potato was cut to the specified, equal weight, which was 1.00 grams. 30ml of sucrose was measured out using a measuring cylinder, the concentrations having already been measured. The concentrations were then placed into 10 different boiling tubes for each concentration. 1 piece of potato was added to each of the test tubes. The boiling tubes were placed in a rack and left for 24 hours. After this time, each piece was taken out and weighed. The results were recorded.
Preliminary Results:
Analysis of Preliminary Results:
The experiment tuned out as expected. There were a few anomalies, which are highlighted in bold, but these were expected. These would have occurred because we did not do any repeats. In the final experiment I hope to do at least three repeats. There are some factors that need to be changed in the method: The amount of solution used was too high and I will only use 30ml in the experiment instead of 40ml. 24 hours was too long and should be brought down to 1.5 hours. With these changes the experiment should turn out better and show clearer, more accurate results.
I also took results from leaving the potato for 24 hours. I gathered results and they showed no difference to the experiment conducted for 1.5 hours. Here are the results to show this:
Looking at these results we can see that they are not much different to the ones conducted in 1.5 hours. I have decided to conduct the final experiment in 1.5 because it will save time and will give the same results if the experiment was conducted for a longer amount of time.
Method:
A regular sized potato was taken and 10 pieces were cut to 1.00 grams accurately using an apple corer. 10 boiling tubes were taken and 30ml of the different concentrations of sucrose were added from 0.2 to 1 mole in 0.2 intervals.
1.5 and 2.0 moles were also measured out and placed in a boiling tube. The pieces of potato were then added and left without stirring for 1.5 hours.
A clock was used to time 1.5 hours. The pieces of potato were then taken out one by one and weighed accurately on scales.
The results were recorded. Different pieces of potato were then cut up to the same weight and the concentrations were accurately measured again and then the experiment could be repeated four times.
Fair test:
I will have to get the measurements and the weights of the solutions and the potatoes as exact, and as accurate as possible. We will try and get the measurements of the potatoes as accurate as possible for every single potato by weighing them and cutting them down with a knife. We will be using a very sensitive balance so that we can get the best readings possible.
I should make sure that the potato is fully covered by the solution. This is because the potato should be fully submerged, and have total contact with the solution.
When using the balance, we will make sure that the balance is reading zero each time before I put the pieces of potato on it. This will be done so that we don’t get a false reading.
I will also be reading the measurements of the measuring cylinder by reading the bottom of the meniscus. This is the correct place to accurately get the exact measurement.
Carrying out the experiment in a constant temperature for the three hours of experiment is important. To avoid temperature change, which might affect the sets of results, we will take the temperature of the solution into account.
Small things such as a dirty test tube, and a slightly cracked measuring cylinder could still affect the results, great care will be taken to check the equipment before using it.
Safety:
We will be using a very sharp knife, which could injure someone if it’s not handled properly. The scales were kept dry from water as to not break them or get an electric shock. I will try not to get the sucrose on my skin and especially not my eyes as it could do some damage. Care will be taken when cutting the potato with the apple corer for it is sharp. Care when carrying boiling tubes will be taken as not to drop them.
Diagram:
Results:
Repeats of the same experiment (grams)
Conclusion:
I feel that the experiment carried out was performed accurately and gave firm, reliable results. We can use the graphs to see how accurate the results were. Looking at my graph we can see there were no major anomalies they all followed a trend and most of the points were on the line of best fit. The graph made a backwards ‘S’ shape and using the letters on the graph I can accurately analyse it. At point ‘A’ the potato has gained weight from 1.0 grams increasing by 24.2% to 1.242 grams. The line of best fit then slowly decreases to 1.185grams at 0.4 moles. This occurs because the concentration of sugar will be higher in the potato, which means that there was a low concentration of water. Outside the potato in a low concentration (hypo tonic solution) there will be less sugar and therefore more water, the water will move due to osmosis down the concentration gradient into the potato. Point ‘B’ on the graph is indicating where there would be equal movement between the potato and sucrose. This would be the dynamic equilibrium and the solution of sucrose outside would be isotonic. Looking at the graph we see that the dynamic equilibrium is at 0.48 moles of sucrose. The line then plunges down to the negatives where the potato starts to loose weight. At point ‘C’ and at 1.0 moles/dm3 the weight of the potato has decreased by 25.3% to 0.747. This would happen because In the higher concentrations (hyper tonic solution) the water concentration will decrease as the sugar level increases and the water will move out of the potato from the low concentration of water to the higher concentration outside the potato. The line of best fit then shallows and then the last point starts to drop off again. Looking at this point I think that I could be an anomaly because the other points at ‘C’ show the decrease in mass to be getting shallower. However the results all follow the same trend. This trend was shown in my prediction. From my graph and results I can see that my prediction was correct exactly.
Plant cells expand until their cellulose walls can stretch no more, or until pressure from surrounding cells stops them from expanding. The cells are fully turgid. The stretched cellulose wall and surrounding cells exerts an inward pressure, which eventually equals the osmotic pressure of the cell sap, so osmosis stops. This process is called plasmolysis. There will be a limit as to how much water can be obtained and lost from the potato cells. My graph and results do not show this and if we had done a larger range of concentrations we could have found out where these limits were.
Using the evidence I have collected I can form a firm, accurate conclusion:
As a 1 gram potato piece is added to the low concentrations of 0.0 to 0.4 it will gain mass and then start to loose mass until there is equal movement between each substance in a dynamic equilibrium. The mass of the potato will then loose more mass in the higher concentrations from 0.6 to 2.0. I can also conclude that the isotonic point is between 0.4 and 0.6 moles/dm3 of sucrose. I know this because between these two points is where the potato changed from gaining weight to loosing weight. The graph’s line of best fit shows this point to be a 0.48moles.
Evaluation:
The experiment was preformed exactly to my method and the results show how accurate the experiment was. There were no major anomalies in the results and they all followed the trend. The percentage increase shows us exactly how much mass the pieces of potato increased by. Working out a percentage makes it easier for us to analyse the results and interpret the results.
Weighing the pieces of potato was the hardest thing to get accurate along with the cutting of the pieces of potato. I had to trust the electronic balance I used, they were not the most accurate and only gave to two decimal places. I did not trust how accurate the last number was and this not being accurate could have altered my results. I thought this because the scales did not look like very good quality.
If I were to repeat this experiment I could weigh each potato piece to a more accurate scale. I could find 0.000 grams instead of 0.00 grams, which is what I have been finding. This would increase the accuracy of the results dramatically. However this could be too accurate because the quality of the equipment used would not be accurate enough to make it worth while.
If I were to repeat the experiment I would possibly find a machine to cut the potato as it would ensure that all potatoes would be the same weight and dimensions. When measuring the amounts of sucrose water I had to poor it into a measuring cylinder, which was not the best way to accurately measure the amount of sucrose. I did remember to measure the amount at the bottom of the meniscus. I could use a burette. This would ensure that I have an accurate amount of fluid in each test tube.
There were not any anomalies but some were not as close to the line of best fit as others. This would be caused different factors where there was a lack of accuracy. When the potato chips were removed from the test tubes and dried I may well have dried some potatoes more thoroughly than others and so some would have more excess water, which would add to the mass. If the experiment were to be repeated I could find another way to dry the potatoes that would ensure that all were dried in the same way for the same time. However with all this said I think that the experiment was successful.
I could use a wider range of concentrations to find the flaccid and turgid points. This would be useful because I could find out the limits of the potato piece. I could also find, accurately, the isotonic solution where there would be equal movement between the potato and sucrose. This was one of the reasons I chose to change the concentration but in the range of concentrations that I used I could not find the isotonic solution. I only know that it was between 0.4 and 0.6 moles of sucrose.