The factors that might affect the rate of reaction are:
- Concentration of each substance in solution
- Particle size of any solid substance
- Temperature
- Presence of a catalyst – if there is a catalyst present, the following factors might also affect the rate of reaction
- Concentration of the catalyst if its in the solution and the volume used
- Particle size of a solid catalyst
- Mass of a solid catalyst
- We achieved a fair test by keeping all the factors (except for the one we were investigating – volume of catalyst used), the same in every experiment.
- Concentration of hydrogen peroxide solution was kept by always using it from the same bottle
- Temperature was kept at room temperature
- The same catalyst was present in every experiment – Manganese (IV) oxide, which acts as a catalyst for the decomposition of hydrogen peroxide
- Particle size of the Manganese (IV) oxide was kept very fine and a solid – always taken from same bottle
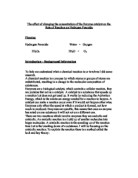
Method
- Set up the apparatus as shown and get a stop clock that is at zero and take off the bung.
-
Add the required amount of Manganese (IV) oxide to 30cm³ of hydrogen peroxide solution (by using a measuring cylinder) very quickly, put on the bung and start the stop clock.
- Measure the amount of oxygen formed in the syringe every 5 seconds from when you start the timer, or if this is too hard then time every 10 seconds until the reaction has stopped.
- Clean the side arm flask with tap water and then distilled water, and push the syringe back to 0cm³.
Do this experiment using one spatula, then 3/4s of a spatula, then half a spatula, then a quarter of a spatula and finally 1 and a half spatulas of Manganese (IV) oxide. In each, use a level spatula, not a heaped one.
Observations
Table to show Volume of oxygen formed in each experiment
From my graphs, with the Time (s) on the x-axis and the Volume of o2 formed (cm³) on the y-axis, I found the rates by dividing volume over time and by drawing a tangent at the beginning, and I displayed them in the table below:
I can assume that the rate without any catalyst is so slow, its zero.
I plotted a graph with rate on the y-axis and amount of catalyst on the y-axis.
I used it to test my hypothesis by choosing a point, x, and the point that was double it, 2x, and drew a line up to the point on the curve. I then extended it to the y-axis. If my hypothesis is correct then the place of 2x on the y-axis should be double the corresponding point.
For x, this is what I found out:
My hypothesis seems to be wrong. However, we must bear in mind that my results are not conclusive so I cannot really say whether they support my hypotheses – that the rate of reaction will double as the amount of catalyst doubles, because the collision theory states that with the catalyst present, the collisions don’t have to be so energetic so more of them will have sufficient energy to lead to reaction.
Evaluation
It is hard to see if there are any anomalous points because there are so few points. Points ‘a’ and ‘b’ on the graph, to show how rate changes according to amount of catalyst, look anomalous but because “spatulas” is such an inaccurate measure, we don’t know if they are anomalous or not.
Sources of error were:
Time ± 1 second
Spatulas ± 1 - the amount of catalyst – was very inaccurate as we used spatulas which aren’t easy to get a level one or to see exactly how much it was, e.g. ½ Vol. hydrogen peroxide ± 0.5 x 2 = 1cm³
It was difficult to measure Vol. of o2 because we had to look at the stop clock very quickly as well as the measurements of the gas in the syringe, and write them down quickly before it changed, so the Vol. of o2 is probably inaccurate as well.
My results do not give a definite answer to whether my hypothesis is correct or not. It was hard to put the bung in the flask quickly so no oxygen escaped out before it could be measured. It was also very hard to measure the Vol. of o2 produced because you had to look at the stop clock syringe and write down the results very quickly. This also meant that we didn’t get very many points as we could only measure the volume every 5 seconds.
An improvement would be to not worry about writing results down as they happened, as just mark the amount of oxygen onto the syringe with a board pen. This would also mean that I’d be able to get more results because I’d be able to get them down at smaller intervals, e.g. every 2 seconds instead of every 5.
A solution for the bung problem would be to use a delivery tube. To get a more accurate measure of catalyst, I would weigh it. I would also repeat the experiment to get averages.