Evaporation: When a liquid evaporates, faster particles escape from its surface to form a gas. However, unless the gas is removed, some of the particles will return to the liquid. Place an insulating material (wood) that fits into the top part of the beaker to reduce evaporation.
Room Temperature: While I carry out the experiment I will make sure that the room temperature is always the same using a thermometer with a ±0.5% accuracy level.
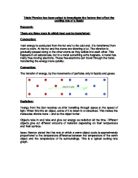
Apparatus:
Glass Thermometer: To measure the temperature of the liquid. (0-100°C)
5 beakers (Sizes: 400ml, 250ml, 150ml, 100ml, and 50ml): I will carry out the experiment in each of these beakers so that I can investigate how the surface area affects the cooling rate.
Stop watch: I will need a stop watch to measure the time it takes for the water to cool from 70°C every sixty seconds.
One layer of wool: To insulate the beakers.
Measuring Cylinder: To accurately measure 50ml of hot water.
A Piece of Wood: To reduce evaporation.
Aluminium Foil: To reduce heat radiation.
Diagram:
Method:
- Collect all equipment shown above, including five different sized beakers.
- Keep the thermometer away from the edge of the table because the substance released from it is poisonous.
- Keep the beakers away from the table to avoid any breakages.
- Pour water in a kettle.
- Boil the kettle.
- Wrap a layer of aluminium foil around the 400ml beaker.
- Wrap wool around the 400ml beaker.
- Place a thermometer inside it.
- Once the kettle has boiled, pour 50ml of water into the 100ml measuring cylinder.
- Record the temperature of the water.
- Start the stopwatch once the thermometer reads 75°C.
- Record the thermometer reading every sixty seconds.
- Record readings in a suitable results table. There should be ten readings altogether.
- Repeat experiment for a fair test.
- Repeat experiment for all other sized beakers.
- Using these results, draw a graph with the temperature along the y-axis and along the x-axis.
- Evaluate your results justifying your prediction.
- Write an analysis based on your findings.
- Write an evaluation describing if you kept the experiment fair.
Readings:
I will record the temperature reading when the temp reaches 75°C. I will record the reading every sixty second between 0-600seconds. This will ensure that I collect ten readings altogether.
Results to show how the Surface Area of all the Beakers Affects the Cooling Rate of Boiling Water:
TEMPERATURE °C
From the results above, I will construct a graph to process the evidence for my conclusion.
Conclusion:
In my prediction, I predicted that the larger the beaker, the less time it will take for the boiling water to cool. However, according to my preliminary study results show that the water in the 100ml beaker cooled down more that the water in the 150ml beaker. The results above show that as the time precedes the temperature decreases. The results also show that as the surface area increases, the temperature of the boiling water decreases.
This is also evident by looking at the 400ml and 50ml graph. According to my prediction, the water in the 400ml beaker should cool quicker than the water in the 50ml beaker. In the first 240seconds of the experiment, the water in the 50ml beaker had decreased in temperature from 75°C to 60°C, and the water in the 400ml beaker had decreased in temperature from 75°C to 60°C. This could have been caused by human errors such as inaccurate thermometer readings. However, after 600seconds, my prediction was proved right as the water in the 50ml beaker cooled down to 55°C whereas the water in the 400ml beaker cooled down to 49°C.
Evaluation:
I think that the method that we carried out was good because it was relatively easy and quick to carry out. Based on the results collected, the procedure was fairly accurate as the results were in close agreement. I think that the results were good enough to support the conclusion. I think the main problem with our experiment was that different people in the group read the thermometer. This led to human errors. In the final experiment I will repeat the experiment twice so that I can build graphs based on average results making it more of a fair test. I will also make sure that the same person reads off the thermometer at all times also ensuring fair testing.
Main Study:
Aim: To investigate how the surface area of a beaker affects the cooling rate of a liquid.
Prediction: I predict that the bigger the beaker, the less time it will take for the liquid to cool down. This is because gases and liquids are more liable to move around which allows them to transfer heat easily by convection. Convection cannot take place in solids because the particles have restrictive movement. This is also evident from the work that I carried out during the preliminary stage of the investigation. Although, some of the results from the preliminary work do not coincide with the research, some results clearly show that as the size of the beaker increases the less time it takes for the liquid to cool. In a bigger beaker, the particles have a larger area to transfer heat to whereas in a smaller beaker water particles have less area to move around in so less heat would be transferred. We know that if anything hot is poured it will eventually cool down. This process is rapid at first, then after a long period of time, the temperature of the liquid reaches room temperature. These temperature variations for cooling objects were summarised by Isaac Newton. He stated that the rate at which a warm object cools is approximately proportional to the temperature difference between the temperature of the warm object and the temperature of its surroundings.
Fair test:
Various factors affect the cooling rate of a liquid and these have been listed in my research. The one factor that I will be looking at is varying the surface area of the beaker. In order to carry out a sensible investigation to produce precise results, I will ensure that other factors that may contribute to the results are kept constant.
Start temperature: Ensure that the initial temperature reading of the water is always 70°C for all experiments. This is to make sure that there is no temperature variation in the start temperature. It will be taken into account that there will be a ±0.5% accuracy level of this reading.
Time: Ensure that the temperature readings are recorded as accurately as possible to sixty seconds for each experiment using a digital stopwatch.
Radiation: Heat Radiation travels through transparent material such as glass. Therefore wrap a layer of aluminium foil around the beaker.
Convection: Convection occurs when particles move from the hotter region to the cooler region. To ensure that no heat is lost due to this place an insulating material (wool) around the beaker.
Evaporation: When a liquid evaporates, faster particles escape from its surface to form a gas. However, unless the gas is removed, some of the particles will return to the liquid. Place an insulating material (wood) that fits into the top part of the beaker to reduce evaporation.
Room Temperature: While I carry out the experiment I will make sure that the room temperature is always the same using a thermometer with a ±0.5% accuracy level.
Apparatus:
Glass Thermometer: To measure the temperature of the liquid. (0-100°C)
5 beakers (Sizes: 400ml, 250ml, 150ml, 100ml, and 50ml): I will carry out the experiment in each of these beakers so that I can investigate how the surface area affects the cooling rate. I will ensure that the same five beakers are used throughout the experiment.
Stop watch: I will need a stop watch to measure the time it takes for the water to cool from 70°C every sixty seconds.
One layer of wool: To insulate the beakers.
50ml Measuring Cylinder: To accurately measure 50ml of hot water. The measuring cylinder has a ±0.5& accuracy level.
A Piece of Wood: To reduce evaporation.
Aluminium Foil: To reduce heat radiation.
Diagram:
Method:
- Collect all equipment shown above, including five different sized beakers.
- Keep the thermometer away from the edge of the table because the substance released from it is poisonous.
- Keep the beakers away from the table to avoid any breakages.
- Pour water in a kettle.
- Boil the kettle.
- Wrap a layer of aluminium foil around the 400ml beaker.
- Wrap wool around the 400ml beaker.
- Place a thermometer inside it.
- Once the kettle has boiled, pour 50ml of water into the 100ml measuring cylinder.
- Record the temperature of the water.
- Start the stopwatch once the thermometer reads 70°C.
- Record the thermometer reading every sixty seconds.
- Record readings in a suitable results table. There should be ten readings altogether.
- Repeat experiment for a fair test.
- Repeat experiment for all other sized beakers.
- Using these results, draw a graph with the temperature along the y-axis and along the x-axis.
- Evaluate your results justifying your prediction.
- Write an analysis based on your findings.
- Write an evaluation describing if you kept the experiment fair.
Readings:
I will record the temperature reading when the temp reaches 70°C. I will record the reading every sixty second between 0-600seconds. This will ensure that I collect ten readings altogether.
Results:
Results to Show how the Surface Area of a 400ml Beaker Affects the Cooling Rate of Boiling Water:
The results above show that as the time proceeds, the temperature of the water decreases. The runs are in close agreement as they are only 1-2°C apart.
Results to Show how the Surface Area of a 250ml Beaker Affects the Cooling Rate of Boiling Water:
The results above show that as the time proceeds, the temperature of the water decreases. The runs are in close agreement as they are only 1-5°C apart. Compared to the results for the 400ml beaker, the cooling rate is generally slower. Also, the water cooled down more in the 400ml beaker than the water in the 250ml beaker.
Results to Show how the Surface Area of a 150ml Beaker Affects the Cooling rate of Boiling Water:
The results above show that as the time proceeds, the temperature of the water decreases. The runs are in close agreement as they are only 1-2°C apart. Compared to the results for the 250ml beaker, the cooling rate is generally slower. Also, the water cooled down more in the 250ml beaker than the water in the 150ml beaker.
Results to Show how the Surface Area of a 100ml Beaker Affects the Cooling Rate of Boiling Water:
The results above show that as the time proceeds, the temperature of the water decreases. The runs are in close agreement as they are only 1-2°C apart. Compared to the results for the 150ml beaker, the cooling rate is generally slower. Also, the water cooled down more in the 150ml beaker than the water in the 100ml beaker.
Results to Show how the Surface Area of a 50ml Beaker Affects the Cooling Rate of Boiling Water:
The results above show that as the time proceeds, the temperature of the water decreases. The runs are in close agreement as they are only 1-2°C apart. Compared to the results for the 100ml beaker, the cooling rate is generally slower. Also, the water cooled down more in the 100ml beaker than the water in the 50ml beaker.
Analysis:
Looking at the graphs, it shows that as the surface area of the beaker increases, the cooling rate increases.
From this experiment, I can conclude that my prediction is right. In my prediction I said that the bigger the beaker, the less time it will take for the water to cool down.
My results clearly show that the water in the 400ml beaker cooled down more than the water in the other beakers. Because at 600 seconds, the water in the 400ml beaker cooled down to 44°C and the water in the 150ml beaker cooled down to 51°C.
Some of the results collected are unusual. For instance, in the first 240 seconds of the experiment the temperature of the water in the 250ml beaker cooled down to 61°C whereas the temperature of the water in the 150ml beaker cooled down to 62°C. According to my prediction, the water in the 250ml beaker should have cooled down more than the water in the 150ml beaker.
Looking at graph 2, there are two anomalous results that occurred in the first 120 seconds in the 250ml beaker. These could have been caused due to insufficient insulation or misreading the thermometer. Other anomalies occurred in graph 3 in the 150 ml beaker at 120 seconds. An anomaly occurred in graph 4 and 5 at 120 seconds. This could have also been caused because the room temperature fluctuated.
The graphs show inverse proportionality. They show that the temperature is inversely proportional to the time. This means that as the time increases, the temperature decreases. Here is a symbol equation relating temperature to time.
The Cooling Rate
To support my prediction, I will calculate the cooling rate per second. The cooling rate means “the rate at which the water is cooling at per second”.
From the table above, the trend is that the cooling rate increases as surface area increases, except from the 250ml and 400ml surface areas. The cooling rates for these two beakers were the same. Using the cooling rate results above, I will construct a surface area-rate graph to prove my prediction.
If my prediction is correct, the graph should form a straight line through the origin.
As the surface area increases, the cooling rate increases. As the surface area doubles, the rate doubles. This is evident by looking at the graph above. The rate of cooling for the 50ml beaker is 0.01°C and the rate of cooling for the 100ml beaker is 0.02. However, this is not noticeable when the surface area increases. I think this has happened because when the surface area increases in size, it has more space and a greater chance of contact with the surrounding air which therefore means that the water will cool down more.
As you can see from the graph above, the rate of cooling should be directly proportional to the surface area. However, an anomaly occurred with the cooling rate of the 400ml. The cooling rate is 0.04°C and according to the line of best fit is should be 0.05°C. This could have been caused by poor insulation.
Generally my results prove my prediction as in my prediction it states that the bigger the beaker, the less time it will take for the water to cool down. One alteration that occurred during the experiment is that the start temperature was 70°C whereas in the preliminary test it was 75°C. The reason for this change was because when reading the initial temperature of the first experiment (400ml beaker); the temperature was 73°C, so we decided to start all experiments at 70°C so that it would be a fair test.
Evaluation:
I think that my method was of good quality because it was easy to carry out. I think that my results were acceptable as the two runs were in close agreement. I have enough results to prove that my prediction was correct.
The results which did not completely agree with my prediction were the results for the 50ml beaker and the results for the 100ml beaker. In the first 120 seconds they both cooled down to 69°C which was the same temperature at the same time for the results for the 250ml beaker. Many anomalous results occurred while carrying out the experiment. This could have been caused by insufficient insulation, fluctuation in the room temperature or misreading the thermometer.
While doing the experiment, we might have measured the thermometer readings incorrectly which means that the results collected were inaccurate.
Another disadvantage of the experiment was that I did not control the external environment.
If I were to do this experiment again, I could place the beakers in a water bath which would ensure that fluctuation of room temperature does not affect the experiment. Alongside this, I could use a digital thermometer which will produce more accurate readings and fewer human inaccuracies.
Inaccuracies also occurred when measuring out the 50ml of water because different members of the group measured the amount of water.
Changes:
In the new method I included a water bath to control the temperature of the external environment. I also included a digital thermometer to record the thermometer readings.
New method and diagram:
- Collect the following:
A Water Bath
5 different sized beakers
1 layer of Wool
Aluminium Foil
Digital Thermometer
100ml Measuring Cylinder
Stop Watch
Pipette
- Set up apparatus as shown below.
- Boil the kettle
- Wrap aluminium foil around the beaker.
- Wrap wool around the beaker.
- Place a thermometer in the beaker.
- Once the kettle has boiled, carefully measure 50ml of the liquid into the measuring cylinder.
- Pour the water into the 400ml beaker.
- Carefully place the beaker into the water bath.
10.) Start the stopwatch.
11.) Record the thermometer readings every sixty seconds.
12.) Record readings in a suitable results table. There should be ten readings altogether.
13.) Repeat experiment for fair test.
14.) Repeat experiment varying surface area of beaker.
Inaccuracy of Equipment.
50ml measuring cylinder- to measure 50ml of water.
Thermometer - to measure the temperature of the water.
Measuring Cylinder
0.5/100 X 100=1% inaccuracy.
Thermometer
0.1/100 X 100=0.1% inaccuracy.
The measuring cylinder and thermometer caused the most inaccuracies, having a 0.1% inaccuracy.