Secondly I found out that the water loses heat differently from the glass to the air. To counter this I shall be putting a piece of card on top of the beaker to stop air getting into it. This will make the results more reliably and consistent.
I also timed how long the water cooled down in around 5 minutes and that came to around 40-60°C which I thought was fairly suitable. I timed if the temperature would change in 30 second intervals and they did so I decided to take around 10 readings in a 5 minute period.
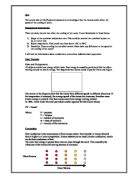
Apparatus
Stand, Kettle, Stop Watch, Different Sized Beakers, Cars and a Thermometer.
Method
• Place beaker in stand
• Boil kettle
• Pour boiled water into beaker at 100ml
• Place card on top of beaker
• Insert thermometer
• Start stopwatch when thermometer is at 80°C
• Start recording results
Readings
I shall be taking 10 readings throughout the 5 minute period each at regular intervals at exactly 30 seconds. I shall only do 1 experiment for each beaker as there is not enough time to do repeats and average results.
Fair Tests/Variables
To keep it a fair test I am going to just change one variable as I mentioned before. That variable will be the size of the beakers. This will keep the test as fair as possible. I will keep everything else the same such as amount of water, same thermometer, and same stopwatch etc.
The only variable that I think is out of control will be the surrounding temperature. The tests that I do cannot be completed in a single lesson and so they will have to be spread out. If the surrounding temperature is different on each day I do the experiment then the rate of cooling will be different. If the surrounding temperature is quite warm then the cooling will be slower. If the surrounding temperature is cooler then the rate of cooling will be faster. I think this would happen because when the heat is transferred from the water to the glass, the heat will then be transferred from the glass to the surrounding air. If that air is cold then the heat will radiate from the glass at a quicker rate as there is a bigger gap between the temperature of the air and the temperature of the glass. If that air was warm then the heat will radiate slower as there is a smaller gap between the temperature of the air and the temperature of the glass. This could affect my results but I don’t think it would change it that dramatically.
Safety
Boiled water will be the main concern as it could spill and burn your hand. When poured into the beaker as well it would be very very hot and almost impossible to lift without getting burnt again. To combat this I will probably lift the beaker with a couple of paper towels around the beaker.
Any glass that is dropped will shatter and break. The broken beaker will have sharp bits and can cut your skin. The water would spill around the floor and someone could slip and fall. These are the main concerns and any experiments will have to be done will great caution.
Calculating Results
To make sure that the surface area to body volume theory is correct I will have to carry out some measuring. I will have to measure the beakers and find out the surface area and volume of each beaker. I will then get both of these measurements and divide by one another to work out the final surface area to body volume ratio. I will only calculate the area of glass that the water is actually touching.
Results
Analysis
The graph clearly shows that the water in the biggest beaker cooled downed the fastest out of them all. This was because the biggest beaker had the most surface area touching the water. Therefore more water molecules could collide and touch the beaker. If molecules lost heat through convection and radiation through the glass then the more molecules touching the glass, the more radiation. This increased more heat loss and so it cooled down faster.
There is almost a straight line running through each result on the graph. At the end of each best line fit though I notice a slight curve. I think at the start of the graph lines it is pretty much straight because I think that the water molecules are hitting the glass at a constant rate. When the kettle heats up the water, it gives the water molecules energy. This energy will make the water molecules move faster and collide with the glass more often. When the water is put into the beaker it will start to lose heat at a constant rate. This is why I think there is a straight line at first. I think the curve occurs when the water molecules start to lose energy. At some point of the cooling the energy loss will be so great that the water molecules begin to slow down and therefore doesn’t hit the glass as often. If it doesn’t hit the glass as often, it cannot radiate heat out more than it did before. And if it doesn’t lose heat as more, it won’t cool down as fast. At the beginning, the molecules have so much energy it can afford to move around quickly and give off heat as well. Near the end though, as it is losing more and more energy it will begin to use the energy more efficiently. The energy will be used for moving the water molecule around and less energy will be lost by heat. This is why I think there is a curve at the end of the graph.
Another factor I think which could have affected my results was the beaker size space between the water and the top of the beaker where there was a piece of card put over it. In the biggest beaker there was a lot more volume between these two points than the volume in the smaller beakers. Water loses heat differently to glass than air. If there is a bigger surface area and volume of air touching the water in the big beaker, and there is a smaller area and volume of air touching the water in the small beaker there will be a variable between all the beaker sizes. This would create an unfair advantage/disadvantage in the rate of cooling. Because there is more air in the biggest beaker, heat will convex into it and warm it up. In the smallest beaker the same principles apply but less air will convex into it as there is not much air to heat up. So in the small beaker it should retain a little bit more heat and in the bigger beaker is should lose a little more heat.
Evaluation
I think that my results were fairly accurate. All the results in the outcome fitted in with the patterns and most of them had the same loss of heat per 30 seconds in the same beaker. I think that something which could have improved my reading was the use of a digital thermometer. I think it would have given me more accurate reading at the precise moments of when I need them. I could also have countered the affect or when the mercury was not on any points/marking and sometimes they were in between. I noticed this in my preliminary work. Use of a digital thermometer I would have had temperature numbers in 1 or 2 decimal places.
I did not find any anomalous results because I think I prepared the experiment well and I eliminated most of the variables possible. I think I could have got more reliable results by doing the experiments 2 or 3 times. I could not do this because we did not have enough time in the lessons to do so. By doing the experiments 2 or 3 times I would have got average results and I could see any results were out of place. The results would be more dependable and consistent.
Even though I did not do any averages I believe I can trust my results as there is a pretty big difference between the temperature loss between the biggest beaker and the smallest beaker. They both started at 80°C and ended up at 52°C and 74.5°C, which makes a difference of 22.5°C. The biggest beaker lost around 3° per 30 seconds while the smallest beaker lost around half a degree per second.
I think that extra work that could be done to support my conclusion would be to instead of changing the beaker size like I did in this experiment is to keep the same beaker, but changed different amount of water. By doing this I can see if instead of the surface area that affects heat loss whether volume of water would affect heat too. I would be able to compare results and put in the surface area to volume ratio as both principles still apply.