Safety
When the experiment is performed, safety goggles must be worn as something might come in contact with your eyes when shaking the solution or pouring it etc. If anything is spilled, it must be wiped up immediately as it might be harmful to other people unaware of what it is.
Prediction
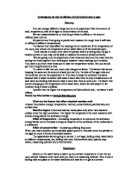
I predict that as the concentration of hydrochloric acid increases, the time taken for the acid to diffuse into the agar decreases and the rate (1000/time in seconds). This is due to there being more particles to move randomly. Each particle has the same amount of kinetic energy, so if there are more particles there is more kinetic energy and more collisions between the H+ and the agar. I predict the graph will look like:
Also, I predict that when the concentration of HCl solution is doubled, the rate of reaction also doubles.
Theory
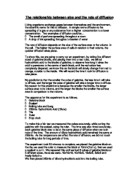
As for the prediction, the following drawings should be considered:
In the first picture, the 10 particles in A would be moving randomly and because there are more particles, there would be more chance of them moving into B where there is a low concentration. In the second drawing, there are fewer particles in A and more movement is required for them to go into B. This is because in the second drawing there is less kinetic energy, as there are fewer particles there. This means the particles are moving slower than in the first so more time is taken for them to pass into the place with a lower concentration.
Also, the particles in the second drawing would take double the time to move in section B, as the chance of them moving into to B is half.
Variables
Results
Analysis
From looking at the graph, there is an obvious relationship between the concentration of HCl and diffusion. There were only tow anomalies that didn’t fit on the line of best fit. The relationship between the concentration of HCl and diffusion is linear but isn’t proportional as the line of best fit doesn’t go through the origin. From looking at the graph, there is some doubling. If you take the intercept (6) away from the result at 1M, then you get 8.5 – 6=2.5 and when you take the intercept away from the result at 2M, then you get 11 – 6=5. When you divide 5 by 2.5, you get 2 showing doubling. Although, this trend is not the same for other points.
The considering the results, the following drawings need to be taken into consideration:
In the first picture, the 10 particles in A would be moving randomly and because there are more particles, there would be more chance of them moving into B where there is a low concentration. In the second drawing, there are fewer particles in A and more movement is required for them to go into B. This is because in the second drawing there is less kinetic energy, as there are fewer particles there. This means the particles are moving slower than in the first so more time is taken for them to pass into the place with a lower concentration.
Also, the particles in the second drawing would take double the time to move in section B, as the chance of them moving into to B is half.
Overall, the results do support my prediction that as the concentration goes up, so does the rate of reaction. Although, my results don’t agree with me prediction as the line of best fit doesn’t go through the origin.
Evaluation
The results support the prediction showing that the experiment was good, but there were some anomalies. In the experiment, there were two anomalies. They were the concentration 1.5M and the concentration at 0.2M. The experiment contained a couple of faults. Two improvements for this experiment would be to use a larger cork borer, as this would mean a larger diffusion time. This would mean that the results would be less inaccurate. The second improvement would be to make sure the agar had no air bubbles on the surface as in the experiment, there were air bubbles and they meant that the agar was had different heights.
There could be three main reasons other than the inaccuracies above that there were anomalies. Firstly, the pipette was not accurate enough; it was accurate to within 0.05ml. Secondly, in the agar, there were actual dips on the surface meaning some pieces were larger than others. Lastly, sometimes the agar floated meaning HCl was not diffusing in from some sides, meaning some took longer.
As far as the reliability was concerned, there were two inaccuracies with the equipment. The pipette could only measure to within 0.05ml. Also, the stopwatch could only measure approximately to the nearest 2seconds because of human reaction time. This is because, when the endpoint is nearing, it is hard to judge whether the solution is colourless or not. If I were to guestimate the percentage, I would say that it is approximately 10%. On the graph, there are error bars to show where the results could have lied. From these results, an alternative line of best fit has been drawn.
An alternative method for this experiment would be to instead of adding agar to the HCl, the HCl would be added to the agar. The agar would be put at the bottom of a beaker, and using a pipette, 20cm3 of HCl would be added right above the centre of the agar piece. The time taken for the agar to turn colourless would be taken.