Therefore, I decided I would test the effect of changing the concentration of the sodium thiosulphate. As you can see from the bottom table below, this experiment gave me much more successful results for me to draw an accurate conclusion, as the time clearly increases as the sodium thiosulphate is less concentrated. These results allow me to see how changing the concentration of the sodium thiosulphate affects the rate of reaction more clearly than my results for changing the acid concentration.
Thus, in my experiment, it would be more suitable to investigate the effect of changing the concentration of the sodium thiosulphate as I know the results I will hopefully achieve will be clear and accurate. I will keep the acid concentration constant at 10cm³.
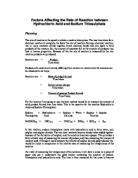
These are the original concentrations of the chemicals used in my experiment:
Sodium Thiosulphate: concentration 40g/litre
Hydrochloric Acid: concentration 1mole/litre
The changes in concentration of both the acid and the sodium thiosulphate tests have been diluted from these original concentrations.
Concentration
Equipment needed
- Sodium thiosulphate
- Hydrochloric acid
- Water
- Conical flask
- Sheet of paper with a pencil-drawn cross on it
- Measuring cylinder
- Stop clock
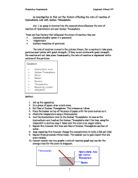
The apparatus will be set up as in the diagram shown below:
Reliability and accuracy of my results
To achieve reliable and accurate results, I will ensure that all my equipment is correctly set up before I begin my experiment. I will make sure all my measuring is carried out accurately, and by using the same glass, the reliability of my results will not be affected as it will be the same shape and depth each time. I will follow my method carefully to minimise any errors. Repeating my experiment will check my results are accurate and eliminate any anomalous results, improving the credibility of my findings, and giving me a solid basis for my conclusion.
Fair Test
In order for my findings to be valid the experiment must be made as fair as possible. To do this, several things will have to be monitored closely to ensure they do not affect the reliability of my results.
Safety
Before starting there are a few safety aspects which I must be aware of and act on appropriately. The substances used in this experiment can be very harmful if used the wrong way, so it is necessary to wear safety goggles at all times during the experiment. Also, because the acid is highly corrosive, it should be kept away from skin and clothes, so an apron may be helpful, but not essential.
Method:
Firstly I drew a black cross on a white piece of paper. Then, I put 10 cm³ of hydrochloric acid in a conical flask (measured using a 10cm³ measuring cylinder), then placed the conical flask on the black cross on the paper. Next, I added 50 cm³ of sodium thiosulphate to the hydrochloric acid, without adding any water. Immediately after the two liquids were in contact, I started the stop clock. I waited for the visibility of the black cross to be completely obscured by the mixture, stopping the clock when this happened. I then recorded the time and washed out the conical flask before starting the next experiment.
Analysis
My results tables and graphs display my findings from this experiment. he first graph plots time taken for the reaction to take place against the concentration of sodium thiosulphate. It has negative correlation, as the time taken for the reaction to take place increases as the concentration becomes more diluted. The highest concentration completes the reaction in 30 seconds, whereas the lowest concentration, 0.1 mols sodium thiosulphate, takes around 600 seconds to complete. The lowest concentration takes around 20 times longer to react than the highest concentration. The line of best fit is a curve because the decrease in time is not proportional as the concentration is diluted.
Graph 2 for experiment 2 shows a similar pattern to the graph for experiment 1. Point 0.6 appears to be anomalous, which is most likely to be due to errors in the timing of the experiment. The rate of reaction increases more or less in proportion to the concentration.
When the sodium thiosulphate is most concentrated, there are a larger number of sodium thiosulphate particles in the same volume. This means that as there are more particles, these particles will collide with each other more frequently, and so more reactions will take place. When there are less sodium thiosulphate particles in the same volume, the particles have more space to move about and so collisions will not be as frequent. This takes the acid longer to react with the sodium thiosulphate and so the rate of reaction decreases.
This also happens in proportion. This is because as the concentration of sodium thiosulphate is increased by 0.1 mols each time, the acid has an extra 0.1 mols of sodium thiosulphate particles to react with. For example, on the average rate of reaction graph, a concentration of 0.5 mols sodium thiosulphate has a reaction rate of 0.0149. The reaction rate for 1 mole sodium thiosulphate, which is double the concentration, is 0.0306. This is roughly double the rate of reaction.
Conclusion
Using my graphs, with lines of best fit, I can draw a conclusion from my experiment. Firstly, I can see that the graph that plots concentration against time taken for the reaction to take place has negative correlation, meaning that as the concentration increased the time taken for the reaction to take place decreased.
The graphs plotting rate against concentration have positive correlation – as the concentration is increased so does the rate of reaction. This is because when solutions of reacting particles are made more concentrated there are more particles per unit volume. Collisions between reacting particles are therefore more likely to occur.
The evidence I have collected clearly shows a relationship between the concentration of sodium thiosulphate and the rate of reaction. From looking at my results and graphs, I am able to conclude that the rate of reaction was quicker when there was a higher concentration of sodium thiosulphate. The more diluted the solution is the longer it takes for the cross to become obscured, and so the slower the rate of reaction.
The concentration affects the number of collisions of reactant particles which affects the rate of the reaction. If the number of collisions per second increases then the rate of the reaction will increase. When the sodium thiosulphate solution is made more concentrated there are more reactant particles per set volume. This makes collisions between the reactant particles more likely. Therefore there will be more collisions per second, so more particles reacting per second, ie the rate of the reaction is increased. The diagram below shows the basics of the collision theory:
On the left the particles show a low concentration of sodium thiosulphate where there is less chance of collision. On the right the particles show a high concentration of sodium thiosulphate, which has a higher chance of collision, which increases the rate of reaction.
I would expect to achieve the same result if I tested two chemicals other than sodium thiosulphate and hydrochloric acid, which are not affected by water, but will react with each other, as the collision theory still applies.
Evaluation
After carrying out my investigation, I feel my results are accurate and my experiment was an overall success. My results indicate a clear relationship, from which I was able to confidently draw a conclusion, confirming my prediction that the more concentrated the sodium thiosulphate, the faster the rate of reaction.
There are certain parts of the experiment which, if I were to repeat again, I would change or improve upon. Firstly, although my results have turned out well and show a good relationship, the method by which the end point of the experiment is determined is rather vague. It is very difficult to know exactly when the cross is no longer visible and also difficult to decide when the solution is at the exact same stage at which the timer was stopped for the last experiment.
To improve upon this a pH indicator such as universal indicator could be added to the solution to allow the chemical change to be monitored more clearly, however, the scientist would still be faced with the same problem over when to determine the end point of the experiment, and to get this exactly the same for each of the experiments.
I could not be certain that all traces of the experiment were completely removed from the conical glass and so I had to assume that after a thorough washing out, the glass would be clean and would not contaminate my next experiment, but this still could have occurred. The only thing I can suggest to improve this fault would be to use a fresh, clean conical glass for each experiment, but by using different equipment this may also cause an inaccuracy in my findings.
The use of a pH meter to monitor the pH of the solution as it is reacting may have helped my experiment by enabling me to see the reaction take place more clearly. To provide more evidence for my investigation I could use a thermometer to measure the temperature of the solution during the experiment to see if any heat is given off and how this may affect the experiment. For further investigation, I could use stronger sodium thiosulphate to see if there is a limit to how quickly the reaction can take place.
Overall, my results and graphs clearly show the relationship between the effect of concentration upon the rate of reaction, so I do not think that the faults in my method have caused any major problems, however, with the suggested improvements I could achieve more accurate and reliable results to support my conclusion further.